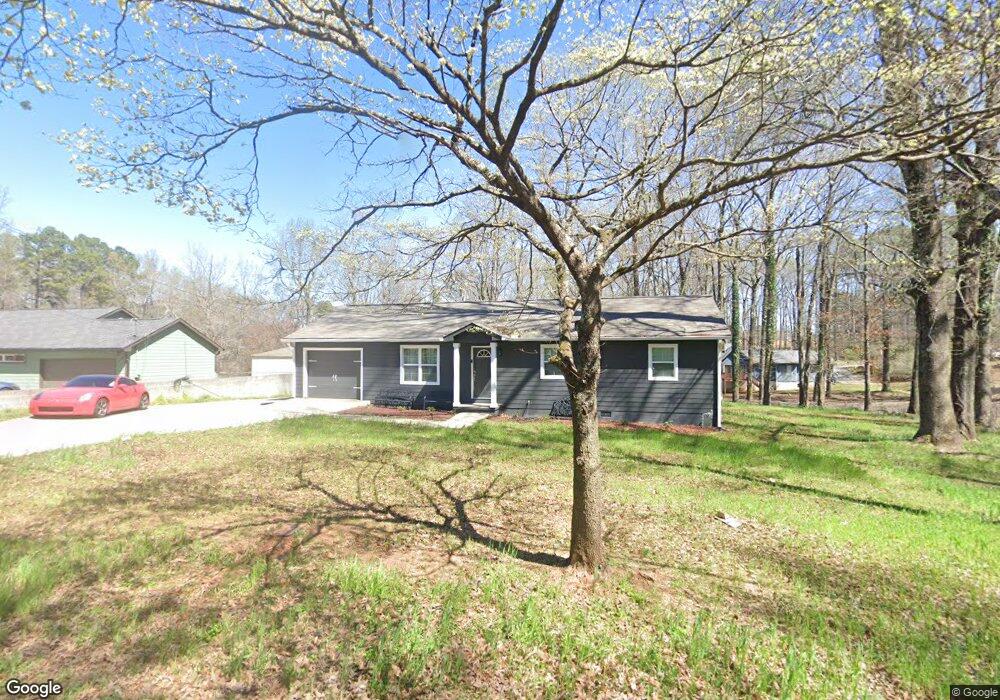
5712 Attucks Blvd Morrow, GA 30260
Estimated Value: $194,835 - $245,000
5
Beds
3
Baths
2,102
Sq Ft
$105/Sq Ft
Est. Value
About This Home
This home is located at 5712 Attucks Blvd, Morrow, GA 30260 and is currently estimated at $220,209, approximately $104 per square foot. 5712 Attucks Blvd is a home located in Clayton County with nearby schools including Thurgood Marshall Elementary School, Morrow Middle School, and Morrow High School.
Ownership History
Date
Name
Owned For
Owner Type
Purchase Details
Closed on
Apr 18, 2024
Sold by
Clayton County Land Bank
Bought by
Williams Steven
Current Estimated Value
Purchase Details
Closed on
Dec 14, 2023
Sold by
Clayton County
Bought by
Clayton County Land Bank
Purchase Details
Closed on
Dec 6, 2013
Sold by
Al-Nas Idrees T
Bought by
Al-Nas Idrees T and Al-Nas Luqman H
Purchase Details
Closed on
May 6, 2013
Sold by
Al-Nas Saleem Rashad
Bought by
Al-Nas Idrees Tauheed
Purchase Details
Closed on
Mar 21, 2011
Sold by
Al-Nas Idrees and Al-Nas Luqmaw
Bought by
Al-Nas Saleem R
Purchase Details
Closed on
Aug 18, 2009
Sold by
Al-Nas Rashad
Bought by
Al-Nas Luqman and Al-Nas Idrees
Create a Home Valuation Report for This Property
The Home Valuation Report is an in-depth analysis detailing your home's value as well as a comparison with similar homes in the area
Home Values in the Area
Average Home Value in this Area
Purchase History
| Date | Buyer | Sale Price | Title Company |
|---|---|---|---|
| Williams Steven | $8,500 | -- | |
| Clayton County Land Bank | -- | -- | |
| Al-Nas Idrees T | -- | -- | |
| Al-Nas Idrees Tauheed | -- | -- | |
| Al-Nas Saleem R | -- | -- | |
| Al-Nas Luqman | -- | -- |
Source: Public Records
Tax History Compared to Growth
Tax History
| Year | Tax Paid | Tax Assessment Tax Assessment Total Assessment is a certain percentage of the fair market value that is determined by local assessors to be the total taxable value of land and additions on the property. | Land | Improvement |
|---|---|---|---|---|
| 2024 | $38 | $62,040 | $2,000 | $60,040 |
| 2023 | $6,437 | $58,200 | $2,000 | $56,200 |
| 2022 | $38 | $40,840 | $2,000 | $38,840 |
| 2021 | $38 | $27,640 | $2,000 | $25,640 |
| 2020 | $483 | $26,094 | $2,000 | $24,094 |
| 2019 | $483 | $24,036 | $1,800 | $22,236 |
| 2018 | $884 | $21,836 | $1,800 | $20,036 |
| 2017 | $483 | $20,944 | $1,800 | $19,144 |
| 2016 | $888 | $20,910 | $1,800 | $19,110 |
| 2015 | $884 | $0 | $0 | $0 |
| 2014 | $834 | $20,014 | $1,800 | $18,214 |
Source: Public Records
Map
Nearby Homes
- 5812 Thompson Blvd
- 5816 Thompson Blvd
- 0 Thompson Blvd
- 5651 Handley Blvd
- The Daisy Plan at Sonata
- The Lily Plan at Sonata
- The Azalea Plan at Sonata
- The Rose Plan at Sonata
- 0 Poplar Ave Unit 10580022
- 0 Poplar Ave Unit 10481115
- 0 Poplar Ave Unit 7543163
- 2272 Santa fe St Unit 21
- 2276 Santa fe St Unit 19
- 2316 Santa fe St Unit 5
- 5516 Bryant Blvd
- 0 Herndon Blvd Unit 10625476
- 5420 Herndon Blvd
- 5385 Booker t Dr
- 5712 Wesson Dr Unit 2
- 5372 Bryant Blvd
- 5702 Attucks Blvd
- 5724 Attucks Blvd
- 5717 Denson Blvd
- 5705 Denson Blvd
- 5727 Denson Blvd
- 5690 Attucks Blvd
- 5734 Attucks Blvd
- 5701 Attucks Blvd
- 5691 Denson Blvd
- 5737 Denson Blvd
- 5742 Attucks Blvd
- 5682 Attucks Blvd
- 13 Bethune Cir
- 2239 Bethune Cir
- 2148 Rex Rd
- 5677 Attucks Blvd
- 2265 Hammond Ct Unit 36
- 2251 Bethune Cir
- 2269 Hammond Ct
- 5754 Attucks Blvd