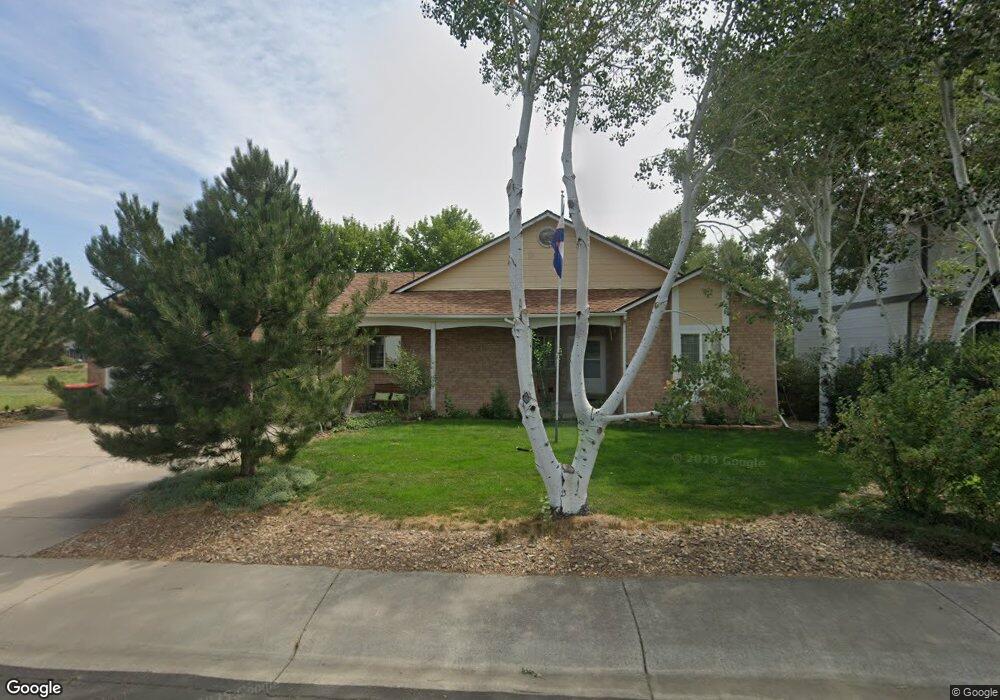
5712 Wetland Loop Longmont, CO 80504
Estimated Value: $569,517 - $617,000
3
Beds
2
Baths
1,854
Sq Ft
$319/Sq Ft
Est. Value
About This Home
This home is located at 5712 Wetland Loop, Longmont, CO 80504 and is currently estimated at $591,129, approximately $318 per square foot. 5712 Wetland Loop is a home located in Weld County with nearby schools including Centennial Elementary School, Coal Ridge Middle School, and Mead High School DUPLICATE DUPLICATE.
Ownership History
Date
Name
Owned For
Owner Type
Purchase Details
Closed on
Aug 28, 2003
Sold by
Weappa Alan R
Bought by
Shaffer Paul D and Shaffer Michelle A
Current Estimated Value
Home Financials for this Owner
Home Financials are based on the most recent Mortgage that was taken out on this home.
Original Mortgage
$227,500
Outstanding Balance
$102,844
Interest Rate
5.87%
Mortgage Type
Unknown
Estimated Equity
$488,285
Purchase Details
Closed on
May 25, 2001
Sold by
Miller Mark and Miller Patricia
Bought by
Weappa Alan R
Home Financials for this Owner
Home Financials are based on the most recent Mortgage that was taken out on this home.
Original Mortgage
$218,300
Interest Rate
7.1%
Purchase Details
Closed on
Sep 10, 1999
Sold by
Chioda Domenic
Bought by
Miller Mark and Miller Patricia
Home Financials for this Owner
Home Financials are based on the most recent Mortgage that was taken out on this home.
Original Mortgage
$30,000
Interest Rate
7.68%
Create a Home Valuation Report for This Property
The Home Valuation Report is an in-depth analysis detailing your home's value as well as a comparison with similar homes in the area
Home Values in the Area
Average Home Value in this Area
Purchase History
| Date | Buyer | Sale Price | Title Company |
|---|---|---|---|
| Shaffer Paul D | $292,500 | -- | |
| Weappa Alan R | $272,900 | Land Title | |
| Miller Mark | $40,000 | -- |
Source: Public Records
Mortgage History
| Date | Status | Borrower | Loan Amount |
|---|---|---|---|
| Open | Shaffer Paul D | $227,500 | |
| Previous Owner | Weappa Alan R | $218,300 | |
| Previous Owner | Miller Mark | $30,000 | |
| Closed | Weappa Alan R | $27,250 |
Source: Public Records
Tax History
| Year | Tax Paid | Tax Assessment Tax Assessment Total Assessment is a certain percentage of the fair market value that is determined by local assessors to be the total taxable value of land and additions on the property. | Land | Improvement |
|---|---|---|---|---|
| 2025 | $3,803 | $36,680 | $7,190 | $29,490 |
| 2024 | $3,803 | $36,680 | $7,190 | $29,490 |
| 2023 | $3,647 | $40,590 | $9,130 | $31,460 |
| 2022 | $3,317 | $31,790 | $5,910 | $25,880 |
| 2021 | $3,349 | $32,700 | $6,080 | $26,620 |
| 2020 | $2,892 | $28,460 | $4,220 | $24,240 |
| 2019 | $2,934 | $28,460 | $4,220 | $24,240 |
| 2018 | $2,459 | $24,760 | $3,740 | $21,020 |
| 2017 | $2,514 | $24,760 | $3,740 | $21,020 |
| 2016 | $2,310 | $22,380 | $3,180 | $19,200 |
| 2015 | $2,239 | $22,380 | $3,180 | $19,200 |
| 2014 | $1,811 | $18,120 | $2,390 | $15,730 |
Source: Public Records
Map
Nearby Homes
- 9020 Sandpiper Dr
- 9147 Harlequin Cir
- 9046 Harlequin Cir
- 9048 Harlequin Cir
- 5508 Mustang Dr
- 5522 Palomino Way
- 5507 Morgan Way
- 5483 Bobcat St
- 5442 Fox Run Blvd
- 5427 Fox Run Blvd
- 8500 Colorado Blvd
- 5426 Fox Run Blvd
- 5316 Bowersox Pkwy
- 5818 County Road 22 Unit 5
- 5818 County Road 22 Unit 4
- 5046 Rangeview Ave
- 8963 Falcon St
- 5230 Warrior St
- 8887 Falcon St
- 9877 Buffalo St
- 5710 Wetland Loop
- 5705 Capistrano Way
- 5831 W Conservation Dr
- 5703 Capistrano Way
- 5707 Capistrano Way
- 5701 Capistrano Way
- 5229 E Conservation Dr
- 5554 Drake St
- 5547 Drake Way
- 5552 Drake St
- 5802 W Conservation Dr
- 5548 Drake Way
- 5806 W Conservation Dr
- 5700 Capistrano Way
- 5702 Capistrano Way
- 5704 Capistrano Way
- 5800 W Conservation Dr
- 5546 Drake Way
- 5765 Bella Rosa Pkwy
- 5808 W Conservation Dr
Your Personal Tour Guide
Ask me questions while you tour the home.