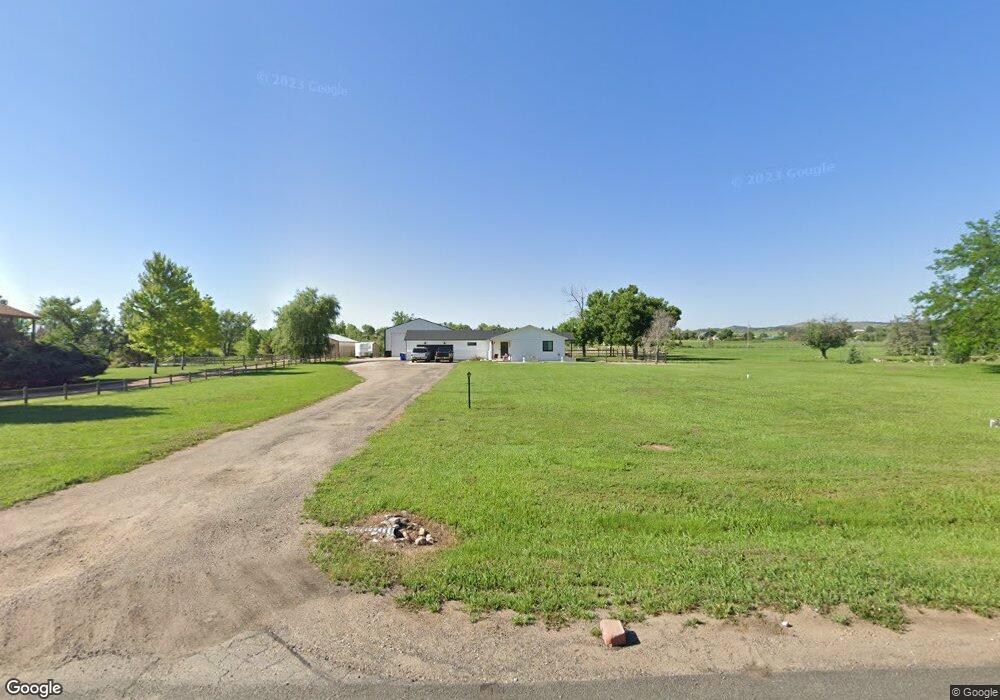
5714 Bitterbush Way Loveland, CO 80537
Estimated Value: $726,000 - $854,000
3
Beds
4
Baths
1,730
Sq Ft
$454/Sq Ft
Est. Value
About This Home
This home is located at 5714 Bitterbush Way, Loveland, CO 80537 and is currently estimated at $785,282, approximately $453 per square foot. 5714 Bitterbush Way is a home located in Larimer County with nearby schools including Namaqua Elementary School, Walt Clark Middle School, and Thompson Valley High School.
Ownership History
Date
Name
Owned For
Owner Type
Purchase Details
Closed on
Dec 9, 2020
Sold by
Klaas Henry C and Klaas Lezilie T
Bought by
Adent Jeremy J and Adent Sara L
Current Estimated Value
Home Financials for this Owner
Home Financials are based on the most recent Mortgage that was taken out on this home.
Original Mortgage
$488,000
Outstanding Balance
$434,466
Interest Rate
2.7%
Mortgage Type
New Conventional
Estimated Equity
$350,816
Purchase Details
Closed on
Dec 23, 2013
Sold by
Klaas Henry C and Klaas Lezilie L
Bought by
Livin Henry C Klaas and Livin Lezilie L Klaas
Purchase Details
Closed on
Oct 26, 2012
Sold by
Klaas Henry C
Bought by
Klaas Lezilie L
Purchase Details
Closed on
Apr 25, 2012
Sold by
Klaas Henry C and Estate Of Elizabeth Charlene K
Bought by
Klaas Henry C
Purchase Details
Closed on
Jun 1, 1983
Bought by
Klaas Henry C and Klaas Charlene E
Create a Home Valuation Report for This Property
The Home Valuation Report is an in-depth analysis detailing your home's value as well as a comparison with similar homes in the area
Home Values in the Area
Average Home Value in this Area
Purchase History
| Date | Buyer | Sale Price | Title Company |
|---|---|---|---|
| Adent Jeremy J | $610,000 | First American | |
| Livin Henry C Klaas | -- | None Available | |
| Klaas Lezilie L | -- | None Available | |
| Klaas Henry C | -- | None Available | |
| Klaas Henry C | $99,500 | -- |
Source: Public Records
Mortgage History
| Date | Status | Borrower | Loan Amount |
|---|---|---|---|
| Open | Adent Jeremy J | $488,000 |
Source: Public Records
Tax History Compared to Growth
Tax History
| Year | Tax Paid | Tax Assessment Tax Assessment Total Assessment is a certain percentage of the fair market value that is determined by local assessors to be the total taxable value of land and additions on the property. | Land | Improvement |
|---|---|---|---|---|
| 2025 | $4,455 | $46,277 | $15,410 | $30,867 |
| 2024 | $4,334 | $46,277 | $15,410 | $30,867 |
| 2022 | $3,555 | $33,499 | $15,123 | $18,376 |
| 2021 | $3,651 | $34,463 | $15,558 | $18,905 |
| 2020 | $3,348 | $31,603 | $12,584 | $19,019 |
| 2019 | $3,206 | $31,603 | $12,584 | $19,019 |
| 2018 | $2,905 | $26,712 | $10,368 | $16,344 |
| 2017 | $1,873 | $26,712 | $10,368 | $16,344 |
| 2016 | $1,654 | $22,805 | $11,303 | $11,502 |
| 2015 | $1,640 | $22,800 | $11,300 | $11,500 |
| 2014 | -- | $21,830 | $11,300 | $10,530 |
Source: Public Records
Map
Nearby Homes
- 5794 Jackdaw Dr
- 347 Meadowsweet Cir
- 404 Black Elk Ct
- 629 Deer Meadow Dr
- 459 Cape Dory Dr
- 684 Deer Meadow Dr
- 270 N Cove Dr
- 5418 Nantucket Ct
- 1016 Meadowridge Ct
- 5053 W County Road 20
- 5925 Sacajawea Way
- 240 Garnet Valley Ct
- 6819 W County Road 18
- 6811 W County Road 20
- 5272 Fox Hollow Ct
- 5072 Saint Andrews Dr
- 435 Clubhouse Ct
- 263 Rossum Dr
- 451 Clubhouse Ct
- 491 Clubhouse Ct
- 5702 Bitterbush Way
- 5804 Bitterbush Way
- 5620 Bitterbush Way
- 5890 Bitterbush Way
- 5543 Bitterbush Way
- 216 Arabian Ct
- 5608 Bitterbush Way
- 5906 Bitterbush Way
- 5531 Bitterbush Way
- 217 Arabian Ct
- 5542 Bitterbush Way
- 204 Arabian Ct
- 5918 Bitterbush Way
- 5519 Bitterbush Way
- 5700 Jackdaw Dr
- 205 Arabian Ct
- 102 Arabian Ct
- 267 Meadowsweet Cir
- 275 Meadowsweet Cir
- 5507 Bitterbush Way