Estimated Value: $228,000 - $255,000
3
Beds
2
Baths
1,846
Sq Ft
$131/Sq Ft
Est. Value
About This Home
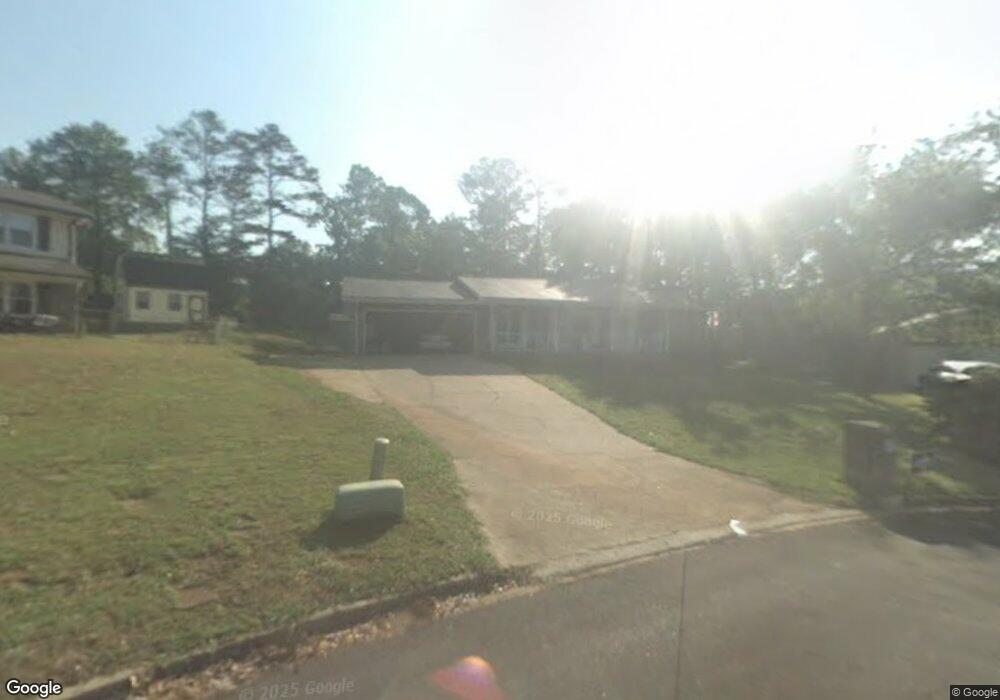
This home is located at 5714 Rally Ct Unit 6, Rex, GA 30273 and is currently estimated at $241,965, approximately $131 per square foot. 5714 Rally Ct Unit 6 is a home located in Clayton County with nearby schools including Roberta T. Smith Elementary School, Adamson Middle School, and Morrow High School.
Ownership History
Date
Name
Owned For
Owner Type
Purchase Details
Closed on
Oct 18, 2013
Sold by
Mcdaniel Brenda
Bought by
Mcdaniel Brenda and Mcdaniel William
Current Estimated Value
Home Financials for this Owner
Home Financials are based on the most recent Mortgage that was taken out on this home.
Original Mortgage
$98,050
Outstanding Balance
$73,734
Interest Rate
4.52%
Mortgage Type
New Conventional
Estimated Equity
$168,231
Purchase Details
Closed on
Aug 5, 2002
Sold by
Bagwell Jo M
Bought by
Mcdaniel Brenda
Home Financials for this Owner
Home Financials are based on the most recent Mortgage that was taken out on this home.
Original Mortgage
$115,000
Interest Rate
6.53%
Mortgage Type
New Conventional
Purchase Details
Closed on
Sep 28, 1993
Sold by
Huff Ronnie D Andrey A
Bought by
Bagwell Jo M
Home Financials for this Owner
Home Financials are based on the most recent Mortgage that was taken out on this home.
Original Mortgage
$63,675
Interest Rate
6.99%
Create a Home Valuation Report for This Property
The Home Valuation Report is an in-depth analysis detailing your home's value as well as a comparison with similar homes in the area
Home Values in the Area
Average Home Value in this Area
Purchase History
| Date | Buyer | Sale Price | Title Company |
|---|---|---|---|
| Mcdaniel Brenda | -- | -- | |
| Mcdaniel Brenda | $115,000 | -- | |
| Bagwell Jo M | $84,900 | -- |
Source: Public Records
Mortgage History
| Date | Status | Borrower | Loan Amount |
|---|---|---|---|
| Open | Mcdaniel Brenda | $98,050 | |
| Previous Owner | Mcdaniel Brenda | $115,000 | |
| Previous Owner | Bagwell Jo M | $63,675 |
Source: Public Records
Tax History Compared to Growth
Tax History
| Year | Tax Paid | Tax Assessment Tax Assessment Total Assessment is a certain percentage of the fair market value that is determined by local assessors to be the total taxable value of land and additions on the property. | Land | Improvement |
|---|---|---|---|---|
| 2024 | $1,327 | $76,400 | $8,000 | $68,400 |
| 2023 | $888 | $79,480 | $8,000 | $71,480 |
| 2022 | $1,001 | $60,040 | $8,000 | $52,040 |
| 2021 | $859 | $52,120 | $8,000 | $44,120 |
| 2020 | $865 | $51,367 | $8,000 | $43,367 |
| 2019 | $832 | $48,573 | $7,200 | $41,373 |
| 2018 | $1,514 | $46,432 | $7,200 | $39,232 |
| 2017 | $1,301 | $41,122 | $7,200 | $33,922 |
| 2016 | $1,370 | $42,820 | $7,200 | $35,620 |
| 2015 | $1,369 | $0 | $0 | $0 |
| 2014 | $1,389 | $34,041 | $7,200 | $26,841 |
Source: Public Records
Map
Nearby Homes
- 4301 Rex Rd Unit I
- 5904 Foxfield Trail
- 5847 Pinetree Ln
- 3874 Rex Cir
- 3821 Rex Mill Square
- 245 Remington Trail
- The Brookwood Plan at Legacy at Stagecoach
- The Northview Plan at Legacy at Stagecoach
- The Thorton Plan at Legacy at Stagecoach
- The Lancaster Plan at Legacy at Stagecoach
- The Chadwick Plan at Legacy at Stagecoach
- The Yorkshire Plan at Legacy at Stagecoach
- The Donovan Plan at Legacy at Stagecoach
- The Cheshire Plan at Legacy at Stagecoach
- 232 Clarkdell Dr
- 305 Belmont Farms Dr
- 5861 Colonnade Dr
- 3694 Rex Rd
- 5810 Mistyview Dr Unit 3
- 20 Roundup Place
- 5722 Rally Ct
- 5710 Rally Ct
- 4095 Rex Rd
- 4103 Rex Rd
- 5732 Rally Ct
- 5737 Bonnell Ct
- 4110 Hunt Way Unit 6
- 5713 Bonnell Ct
- 5719 Rally Ct
- 5719 Rally Ct Unit 6
- 5740 Rally Ct
- 4119 Rex Rd
- 5691 Bonnell Ct
- 5701 Bonnell Ct
- 5741 Bonnell Ct Unit 2
- 4098 Hunt Way
- 5752 Rally Ct
- 5752 Rally Ct Unit 17
- 4098 Rex Rd
- 4077 Rex Rd