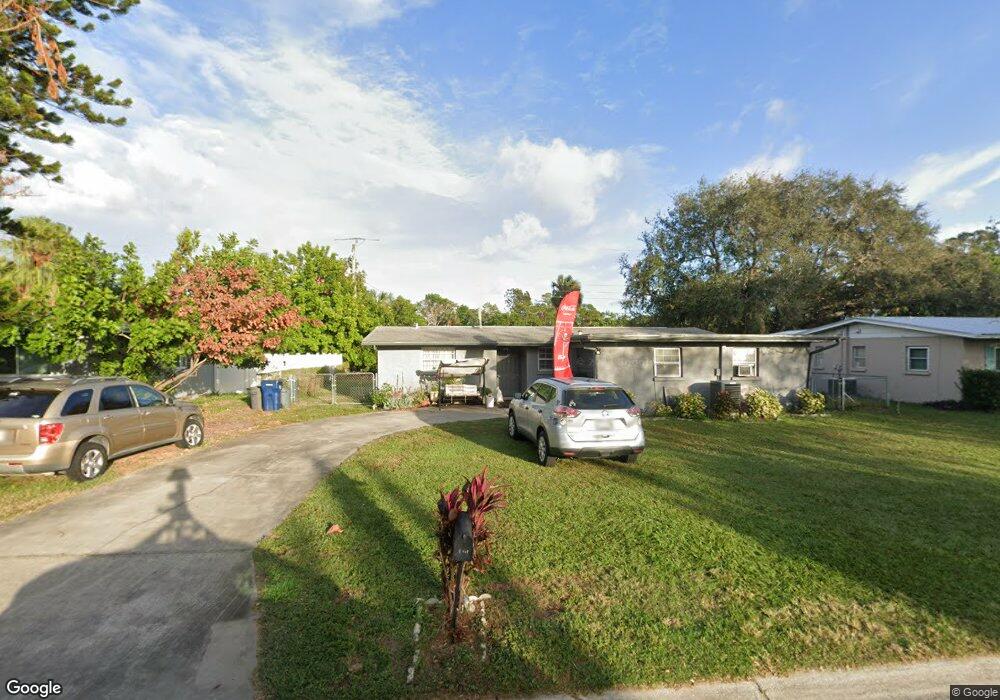
5715 21st St W Bradenton, FL 34207
Estimated Value: $257,000 - $278,000
2
Beds
1
Bath
891
Sq Ft
$297/Sq Ft
Est. Value
About This Home
This home is located at 5715 21st St W, Bradenton, FL 34207 and is currently estimated at $264,252, approximately $296 per square foot. 5715 21st St W is a home located in Manatee County with nearby schools including Bayshore Elementary School, Electa Lee Magnet Middle School, and Bayshore High School.
Ownership History
Date
Name
Owned For
Owner Type
Purchase Details
Closed on
Jul 8, 2015
Sold by
Marciano Scott A and Marciano Renee M
Bought by
Marciano Renee M
Current Estimated Value
Purchase Details
Closed on
Dec 19, 2000
Sold by
Miner Richard H and Miner Debbie V
Bought by
Marciano Scott and Marciano Renee
Home Financials for this Owner
Home Financials are based on the most recent Mortgage that was taken out on this home.
Original Mortgage
$89,954
Outstanding Balance
$33,197
Interest Rate
7.72%
Mortgage Type
FHA
Estimated Equity
$231,055
Purchase Details
Closed on
Jun 18, 1997
Sold by
Miner Debbie V
Bought by
Miner Richard H
Purchase Details
Closed on
Apr 19, 1996
Sold by
Johnson Hallie R and Johnson Peggy L
Bought by
Miner Richard H and Miner Debbie V
Home Financials for this Owner
Home Financials are based on the most recent Mortgage that was taken out on this home.
Original Mortgage
$69,964
Interest Rate
7.36%
Mortgage Type
FHA
Create a Home Valuation Report for This Property
The Home Valuation Report is an in-depth analysis detailing your home's value as well as a comparison with similar homes in the area
Home Values in the Area
Average Home Value in this Area
Purchase History
| Date | Buyer | Sale Price | Title Company |
|---|---|---|---|
| Marciano Renee M | -- | Attorney | |
| Marciano Scott | $90,000 | -- | |
| Miner Richard H | -- | -- | |
| Miner Richard H | $70,000 | -- |
Source: Public Records
Mortgage History
| Date | Status | Borrower | Loan Amount |
|---|---|---|---|
| Open | Marciano Scott | $89,954 | |
| Previous Owner | Miner Richard H | $69,964 |
Source: Public Records
Tax History
| Year | Tax Paid | Tax Assessment Tax Assessment Total Assessment is a certain percentage of the fair market value that is determined by local assessors to be the total taxable value of land and additions on the property. | Land | Improvement |
|---|---|---|---|---|
| 2025 | $713 | $63,672 | -- | -- |
| 2023 | $693 | $60,076 | $0 | $0 |
| 2022 | $669 | $58,326 | $0 | $0 |
| 2021 | $633 | $56,627 | $0 | $0 |
| 2020 | $645 | $55,845 | $0 | $0 |
| 2019 | $631 | $54,589 | $0 | $0 |
| 2018 | $619 | $53,571 | $0 | $0 |
| 2017 | $582 | $52,469 | $0 | $0 |
| 2016 | $577 | $51,390 | $0 | $0 |
Source: Public Records
Map
Nearby Homes
- 5812 22nd St W
- 5823 22nd St W
- 5815 24th St W
- 5615 24th St W
- 2039 Canal Dr Unit N33
- 2009 Canal Dr Unit N4
- 2053 Canal Dr Unit L3
- 2008 Canal Dr Unit M3
- 5855 Palm Ln Unit B21
- 5873 Palm Ln Unit B33
- 5912 Palm Ln Unit C36
- 5619 25th St W
- 5850 Welcome Rd Unit J6
- 1868 Sunny Dr Unit F26
- 5938 Welcome Rd Unit H22
- 1858 Sunny Dr Unit F21
- 1849 Sunny Dr Unit G3
- 1867 Restful Dr Unit L22
- 1853 Restful Dr Unit L2
- 5907 Garden Ln Unit H26
Your Personal Tour Guide
Ask me questions while you tour the home.