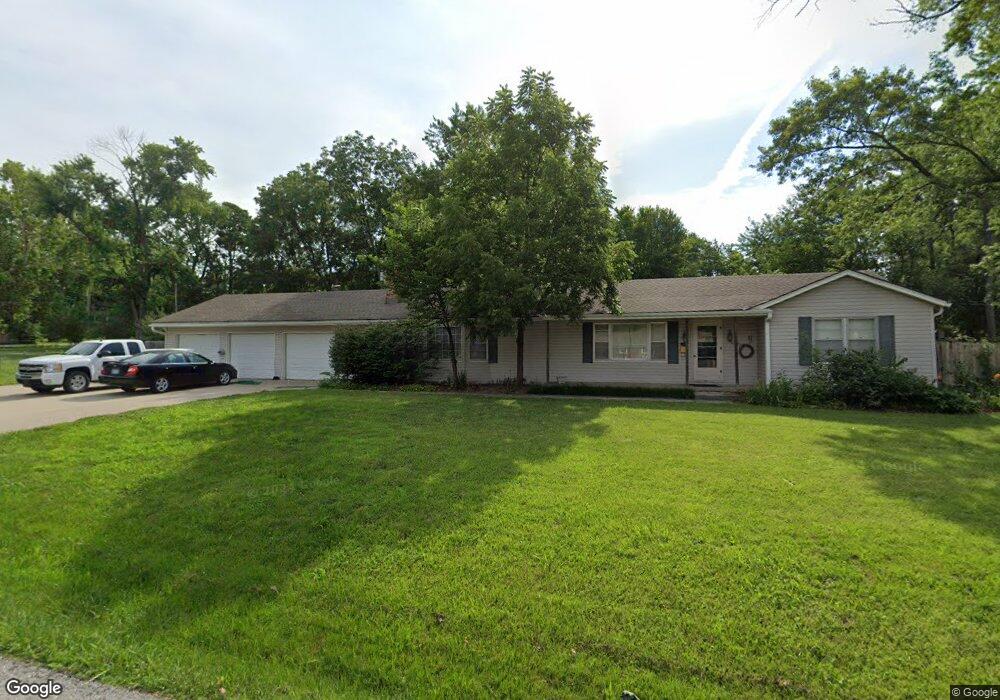
5715 Long Ave Shawnee, KS 66216
Estimated Value: $287,000 - $340,000
3
Beds
2
Baths
1,730
Sq Ft
$181/Sq Ft
Est. Value
About This Home
This home is located at 5715 Long Ave, Shawnee, KS 66216 and is currently estimated at $313,990, approximately $181 per square foot. 5715 Long Ave is a home located in Johnson County with nearby schools including Ray Marsh Elementary School, Trailridge Middle School, and Shawnee Mission Northwest High School.
Ownership History
Date
Name
Owned For
Owner Type
Purchase Details
Closed on
Jul 30, 2018
Sold by
Owens Robbie L
Bought by
Owens Albert L
Current Estimated Value
Purchase Details
Closed on
Oct 2, 2012
Sold by
Owens Albert L and Owens Robbie L
Bought by
Owens Albert L and Owens Robbie L
Home Financials for this Owner
Home Financials are based on the most recent Mortgage that was taken out on this home.
Original Mortgage
$96,100
Outstanding Balance
$65,670
Interest Rate
3.61%
Mortgage Type
New Conventional
Estimated Equity
$248,320
Purchase Details
Closed on
Jan 10, 2007
Sold by
Fanning Angela L
Bought by
Owens Albert L and Lynn Owens R
Home Financials for this Owner
Home Financials are based on the most recent Mortgage that was taken out on this home.
Original Mortgage
$106,000
Interest Rate
6.09%
Mortgage Type
New Conventional
Purchase Details
Closed on
Apr 12, 2001
Sold by
Fanning Timothy J
Bought by
Fanning Angela L
Create a Home Valuation Report for This Property
The Home Valuation Report is an in-depth analysis detailing your home's value as well as a comparison with similar homes in the area
Home Values in the Area
Average Home Value in this Area
Purchase History
| Date | Buyer | Sale Price | Title Company |
|---|---|---|---|
| Owens Albert L | -- | None Available | |
| Owens Albert L | -- | Platinum Title | |
| Owens Albert L | -- | Kansas City Title | |
| Fanning Angela L | -- | -- |
Source: Public Records
Mortgage History
| Date | Status | Borrower | Loan Amount |
|---|---|---|---|
| Open | Owens Albert L | $96,100 | |
| Closed | Owens Albert L | $106,000 |
Source: Public Records
Tax History
| Year | Tax Paid | Tax Assessment Tax Assessment Total Assessment is a certain percentage of the fair market value that is determined by local assessors to be the total taxable value of land and additions on the property. | Land | Improvement |
|---|---|---|---|---|
| 2025 | $2,760 | $27,738 | $6,140 | $21,598 |
| 2023 | $2,686 | $25,128 | $6,140 | $18,988 |
| 2022 | $2,377 | $22,161 | $5,579 | $16,582 |
| 2021 | $2,294 | $19,918 | $4,846 | $15,072 |
| 2020 | $1,932 | $16,525 | $4,409 | $12,116 |
| 2019 | $1,905 | $16,284 | $3,678 | $12,606 |
| 2018 | $1,624 | $19,343 | $3,337 | $16,006 |
| 2017 | $2,207 | $18,538 | $3,337 | $15,201 |
| 2016 | $1,882 | $15,582 | $3,337 | $12,245 |
| 2015 | $1,729 | $14,973 | $3,337 | $11,636 |
| 2013 | -- | $14,559 | $3,337 | $11,222 |
Source: Public Records
Map
Nearby Homes
- 5711 Westgate St
- 5702 Halsey St
- 5519 Monrovia St
- 11903 W 58th Terrace Unit H
- 5751 Richards Cir
- 11700 Johnson Dr
- 12000 W 60th Place
- 6010 E Richards Dr
- 13130 W 52nd Terrace
- 5406 Lucille Ln
- 13216 W 55th Terrace
- 11219 W 57th Terrace
- 11223 W 59th St
- 12712 W 51st St
- 6127, 6129 and lot Pflumm Rd
- 5828 Park Cir
- 5021 Bradshaw St
- 5703 Cottonwood St
- 13505 W 53rd Terrace
- 13721 W 58th Terrace Unit 1
Your Personal Tour Guide
Ask me questions while you tour the home.