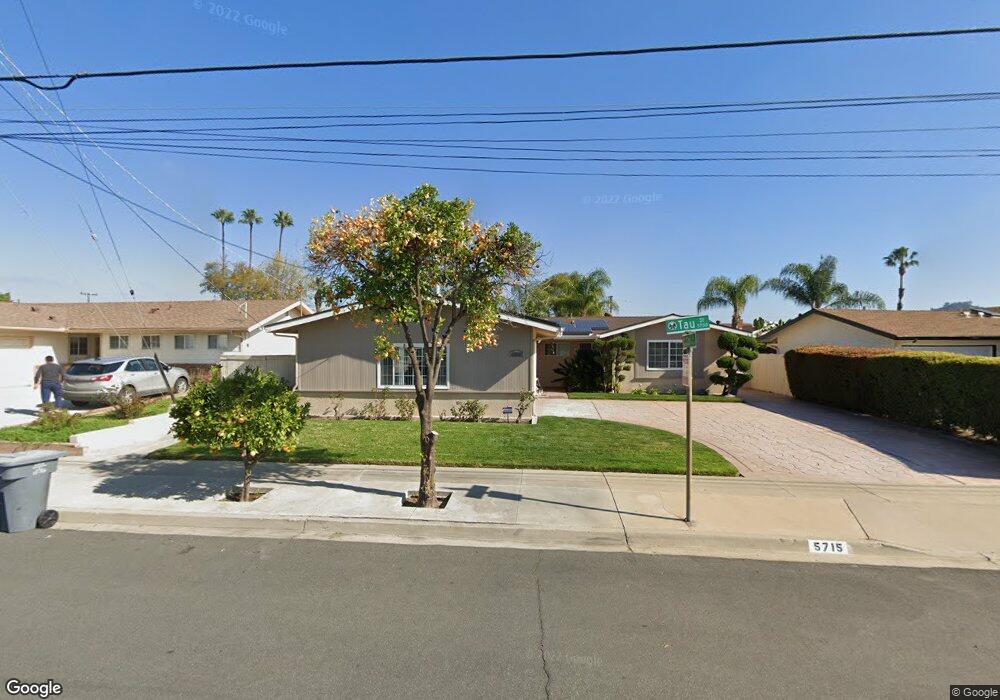
5715 Tau St La Mesa, CA 91942
Estimated Value: $892,000 - $932,000
3
Beds
2
Baths
1,681
Sq Ft
$542/Sq Ft
Est. Value
About This Home
This home is located at 5715 Tau St, La Mesa, CA 91942 and is currently estimated at $911,372, approximately $542 per square foot. 5715 Tau St is a home located in San Diego County with nearby schools including Murray Manor Elementary School, Parkway Academy, and Grossmont High School.
Ownership History
Date
Name
Owned For
Owner Type
Purchase Details
Closed on
Jul 16, 2015
Sold by
Sidiropoulos Dimitrios L
Bought by
Sidiropoulos Despina
Current Estimated Value
Home Financials for this Owner
Home Financials are based on the most recent Mortgage that was taken out on this home.
Original Mortgage
$90,000
Interest Rate
4.01%
Mortgage Type
Credit Line Revolving
Purchase Details
Closed on
Feb 5, 1999
Sold by
Dimitrios Sidiropoulos
Bought by
Sidiropoulos Dimitrios and Sidiropoulos Despina
Home Financials for this Owner
Home Financials are based on the most recent Mortgage that was taken out on this home.
Original Mortgage
$144,750
Interest Rate
6.79%
Purchase Details
Closed on
Jul 24, 1997
Sold by
Dimitrios Sidiropoulos
Bought by
Sidiropoulos Dimitrios and Sidiropoulos Despina
Create a Home Valuation Report for This Property
The Home Valuation Report is an in-depth analysis detailing your home's value as well as a comparison with similar homes in the area
Home Values in the Area
Average Home Value in this Area
Purchase History
| Date | Buyer | Sale Price | Title Company |
|---|---|---|---|
| Sidiropoulos Despina | -- | Orange Coast Title | |
| Sidiropoulos Dimitrios | -- | California Title Company | |
| Sidiropoulos Dimitrios | -- | California Title Company | |
| Sidiropoulos Dimitrios | -- | -- |
Source: Public Records
Mortgage History
| Date | Status | Borrower | Loan Amount |
|---|---|---|---|
| Previous Owner | Sidiropoulos Despina | $90,000 | |
| Previous Owner | Sidiropoulos Dimitrios | $144,750 |
Source: Public Records
Tax History Compared to Growth
Tax History
| Year | Tax Paid | Tax Assessment Tax Assessment Total Assessment is a certain percentage of the fair market value that is determined by local assessors to be the total taxable value of land and additions on the property. | Land | Improvement |
|---|---|---|---|---|
| 2025 | $2,109 | $139,944 | $43,169 | $96,775 |
| 2024 | $2,109 | $137,201 | $42,323 | $94,878 |
| 2023 | $2,046 | $134,512 | $41,494 | $93,018 |
| 2022 | $2,055 | $131,876 | $40,681 | $91,195 |
| 2021 | $1,993 | $129,291 | $39,884 | $89,407 |
| 2020 | $1,942 | $127,967 | $39,476 | $88,491 |
| 2019 | $1,922 | $125,458 | $38,702 | $86,756 |
| 2018 | $1,939 | $122,999 | $37,944 | $85,055 |
| 2017 | $50 | $120,588 | $37,200 | $83,388 |
| 2016 | $1,883 | $118,224 | $36,471 | $81,753 |
| 2015 | $1,853 | $116,449 | $35,924 | $80,525 |
| 2014 | -- | $114,169 | $35,221 | $78,948 |
Source: Public Records
Map
Nearby Homes
- 8195 Chaz Place
- 5975 Nagel St
- 8100 Place
- 5760 Marengo Ave
- 5170 Randlett Dr
- 5800 Lake Murray Blvd Unit 49
- 5800 Lake Murray Blvd Unit 83
- 6209 Amber Lake Ave
- 5350 Baltimore Dr Unit 20
- 5350 Baltimore Dr Unit 58
- 5661 Lake Park Way Unit 4
- 4900 Rosehedge Dr Unit 415
- 7750 Ropalt St
- 7780 Parkway Dr Unit 104
- 8364 Lake Ashwood Ave
- 6272 S Lake Ct
- 5430 Baltimore Dr
- 5430 Baltimore Dr Unit 51
- 6368 Lake Atlin Ave
- 6060 Cowles Mountain Blvd