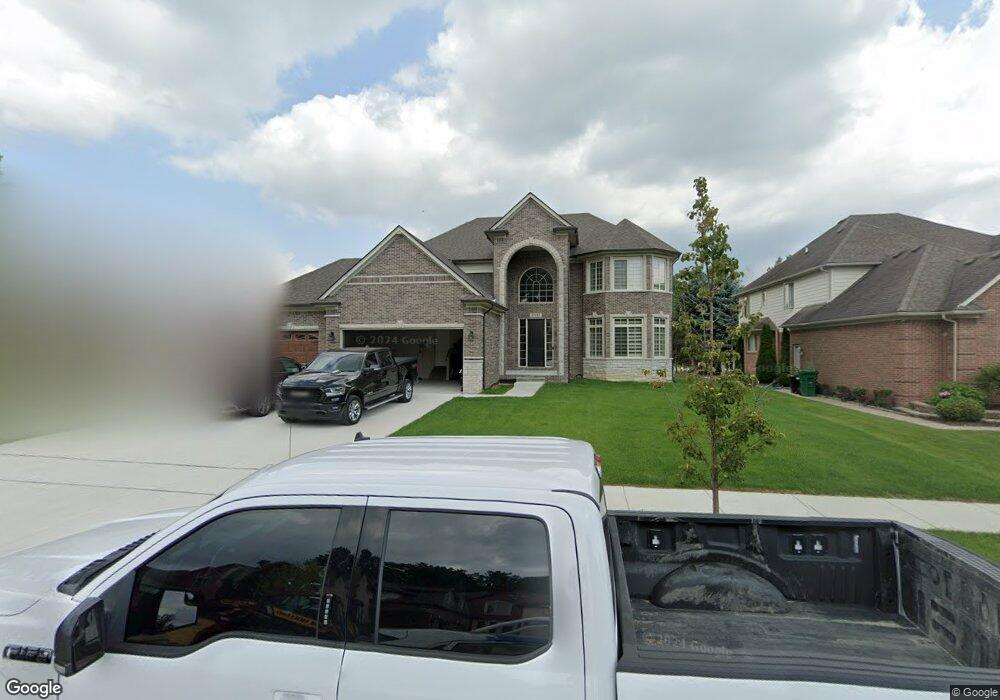
57152 Covington Dr Unit Bldg-Unit Washington, MI 48094
Estimated Value: $658,000 - $710,000
4
Beds
3
Baths
2,896
Sq Ft
$238/Sq Ft
Est. Value
About This Home
This home is located at 57152 Covington Dr Unit Bldg-Unit, Washington, MI 48094 and is currently estimated at $687,818, approximately $237 per square foot. 57152 Covington Dr Unit Bldg-Unit is a home located in Macomb County with nearby schools including Richard J. Duncan Elementary, Malow Junior High School, and Eisenhower High School.
Ownership History
Date
Name
Owned For
Owner Type
Purchase Details
Closed on
Apr 4, 2023
Sold by
Shaooni Rob
Bought by
Abdaal Thikra
Current Estimated Value
Purchase Details
Closed on
Jul 23, 2020
Sold by
Allante Building Company
Bought by
Shaooni Rob and Abdaal Thikra
Purchase Details
Closed on
Apr 30, 2018
Sold by
Ardelean Liliana
Bought by
Allante Building Company
Purchase Details
Closed on
Jan 23, 2018
Sold by
Ardelean Adelaida L
Bought by
Ardelean Liliana
Purchase Details
Closed on
Jun 2, 2014
Sold by
Ardelean Benjamin D
Bought by
Ardelean Liliana
Purchase Details
Closed on
Feb 16, 2014
Sold by
Ardelean Liliana
Bought by
Ardelean Adelaida L
Purchase Details
Closed on
Jul 27, 2005
Sold by
Manzella Construction Inc
Bought by
Ardelean Benjamin
Purchase Details
Closed on
Apr 17, 2001
Sold by
Stonebriar Dev Corp
Bought by
Manzella Construction Inc
Create a Home Valuation Report for This Property
The Home Valuation Report is an in-depth analysis detailing your home's value as well as a comparison with similar homes in the area
Home Values in the Area
Average Home Value in this Area
Purchase History
| Date | Buyer | Sale Price | Title Company |
|---|---|---|---|
| Abdaal Thikra | -- | None Listed On Document | |
| Abdaal Thikra | -- | None Listed On Document | |
| Shaooni Rob | $453,000 | Ata National Title Group Llc | |
| Allante Building Company | $85,000 | Liberty Title | |
| Ardelean Liliana | -- | None Available | |
| Ardelean Liliana | -- | None Available | |
| Ardelean Adelaida L | -- | None Available | |
| Ardelean Benjamin | $108,000 | Greco | |
| Manzella Construction Inc | $80,000 | -- |
Source: Public Records
Tax History
| Year | Tax Paid | Tax Assessment Tax Assessment Total Assessment is a certain percentage of the fair market value that is determined by local assessors to be the total taxable value of land and additions on the property. | Land | Improvement |
|---|---|---|---|---|
| 2025 | $5,481 | $338,400 | $0 | $0 |
| 2024 | $53 | $337,200 | $0 | $0 |
| 2023 | $5,052 | $291,700 | $0 | $0 |
| 2022 | $7,784 | $266,000 | $0 | $0 |
| 2021 | $7,579 | $253,800 | $0 | $0 |
| 2020 | $4,014 | $221,200 | $0 | $0 |
| 2019 | $1,867 | $66,200 | $0 | $0 |
| 2018 | $1,026 | $48,800 | $0 | $0 |
| 2017 | $1,513 | $46,000 | $0 | $0 |
| 2016 | $1,810 | $46,000 | $0 | $0 |
| 2015 | -- | $25,000 | $0 | $0 |
| 2013 | $1,014 | $30,000 | $30,000 | $0 |
| 2012 | $1,014 | $20,500 | $0 | $0 |
Source: Public Records
Map
Nearby Homes
- 57563 Stonebriar Dr
- 13970 Quail View Dr
- 13827 Arthur Ct
- 13987 Quail View Dr
- 57629 Stonebriar Dr
- 57011 Veridian Blvd
- 13953 Quail View Dr
- 57373 Glen Forest Dr
- 57496 Meadowridge Dr
- 13924 Arthur Ct
- 57192 Meadowridge Dr
- 57325 Meadowridge Dr
- 13958 Arthur Ct
- 13984 Arthur Ct
- 56357 Twin Birch Blvd
- 13743 Stone Falcon N
- 13696 Eagles Way Dr
- 56211 Stone Falcon Dr
- 13772 Stone Falcon N
- 13732 Eagles Way Dr
- 57152 Covington Dr
- 57130 Covington Dr
- 57174 Covington Dr
- 57108 Covington Dr
- 57196 Covington Dr
- 57240 Schoenherr Rd
- 57155 Covington Dr
- 57086 Covington Dr
- 57133 Covington Dr
- 57218 Covington Dr
- 57177 Covington Dr
- 57111 Covington Dr
- 57200 Schoenherr Rd
- 57199 Covington Dr
- 57064 Covington Dr
- 57240 Covington Dr
- 57089 Covington Dr
- 57221 Covington Dr
- 57243 Covington Dr
- 57067 Covington Dr
Your Personal Tour Guide
Ask me questions while you tour the home.