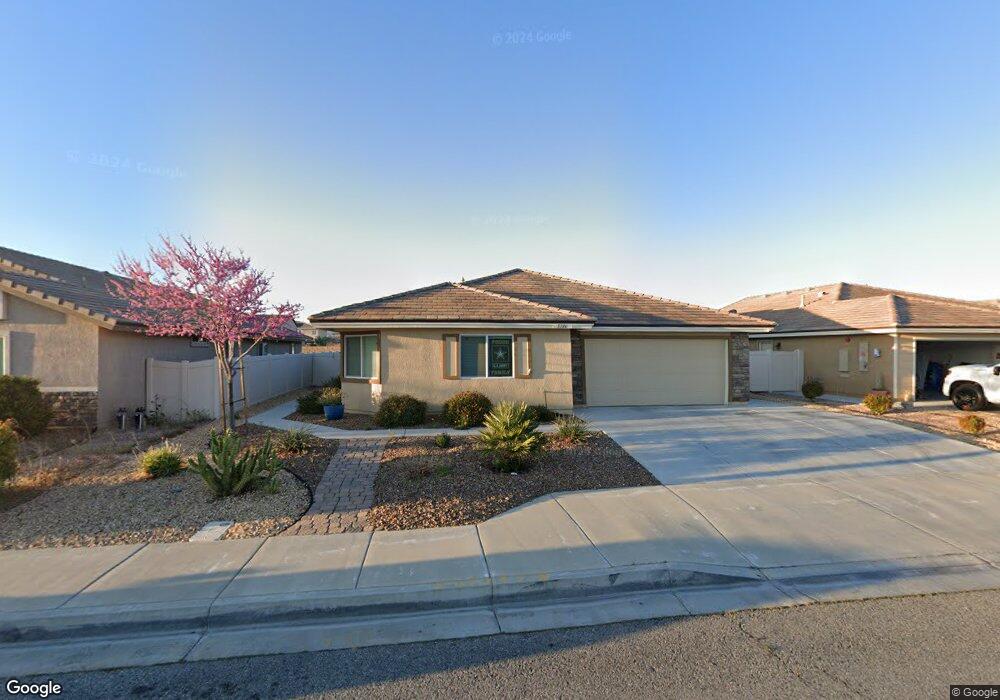
5716 Forry Ct Lancaster, CA 93536
West Lancaster NeighborhoodEstimated Value: $539,058 - $579,000
4
Beds
2
Baths
2,147
Sq Ft
$260/Sq Ft
Est. Value
About This Home
This home is located at 5716 Forry Ct, Lancaster, CA 93536 and is currently estimated at $559,015, approximately $260 per square foot. 5716 Forry Ct is a home with nearby schools including Sundown Elementary School, Lancaster High School, and Fabunni Private School Inc..
Ownership History
Date
Name
Owned For
Owner Type
Purchase Details
Closed on
Jun 13, 2017
Sold by
Harris Homes Inc
Bought by
Lathrop Brian and Lathrop Becky
Current Estimated Value
Home Financials for this Owner
Home Financials are based on the most recent Mortgage that was taken out on this home.
Original Mortgage
$373,117
Interest Rate
4.12%
Mortgage Type
FHA
Purchase Details
Closed on
Dec 7, 2007
Sold by
Lancaster Pavilion Lp
Bought by
Harris Homes Inc
Create a Home Valuation Report for This Property
The Home Valuation Report is an in-depth analysis detailing your home's value as well as a comparison with similar homes in the area
Home Values in the Area
Average Home Value in this Area
Purchase History
| Date | Buyer | Sale Price | Title Company |
|---|---|---|---|
| Lathrop Brian | $380,000 | First American Title Company | |
| Harris Homes Inc | $5,256,000 | Old Republic Title Company |
Source: Public Records
Mortgage History
| Date | Status | Borrower | Loan Amount |
|---|---|---|---|
| Previous Owner | Lathrop Brian | $373,117 |
Source: Public Records
Tax History
| Year | Tax Paid | Tax Assessment Tax Assessment Total Assessment is a certain percentage of the fair market value that is determined by local assessors to be the total taxable value of land and additions on the property. | Land | Improvement |
|---|---|---|---|---|
| 2025 | $6,658 | $432,369 | $108,091 | $324,278 |
| 2024 | $6,658 | $423,892 | $105,972 | $317,920 |
| 2023 | $6,588 | $415,582 | $103,895 | $311,687 |
| 2022 | $6,342 | $407,434 | $101,858 | $305,576 |
| 2021 | $5,898 | $399,446 | $99,861 | $299,585 |
| 2019 | $5,745 | $387,600 | $96,900 | $290,700 |
| 2018 | $5,664 | $380,000 | $95,000 | $285,000 |
| 2016 | $1,787 | $76,114 | $76,114 | $0 |
| 2015 | $1,624 | $74,971 | $74,971 | $0 |
| 2014 | $1,282 | $73,503 | $73,503 | $0 |
Source: Public Records
Map
Nearby Homes
- 43830 Elena Ct
- 0 St W Unit 26000550
- 5659 W Avenue j15
- 43637 59th St W
- 0 61st St W
- 60 W Avenue J-4
- 6135 W Avenue J 9
- 0 56th West & J3
- 0 W Avenue K Unit CV24074666
- 0 W Avenue K Unit SR25161579
- 6147 W Avenue j15
- 5727 W Avenue K-2
- 5727 W Avenue k2
- 6144 Treehaven Ct
- 6223 W Avenue j12
- 44335 57th St W
- 44020 52nd St W
- 43749 Tahoe Way
- 0 53rd St West and Avenue F
- 0 St
Your Personal Tour Guide
Ask me questions while you tour the home.