
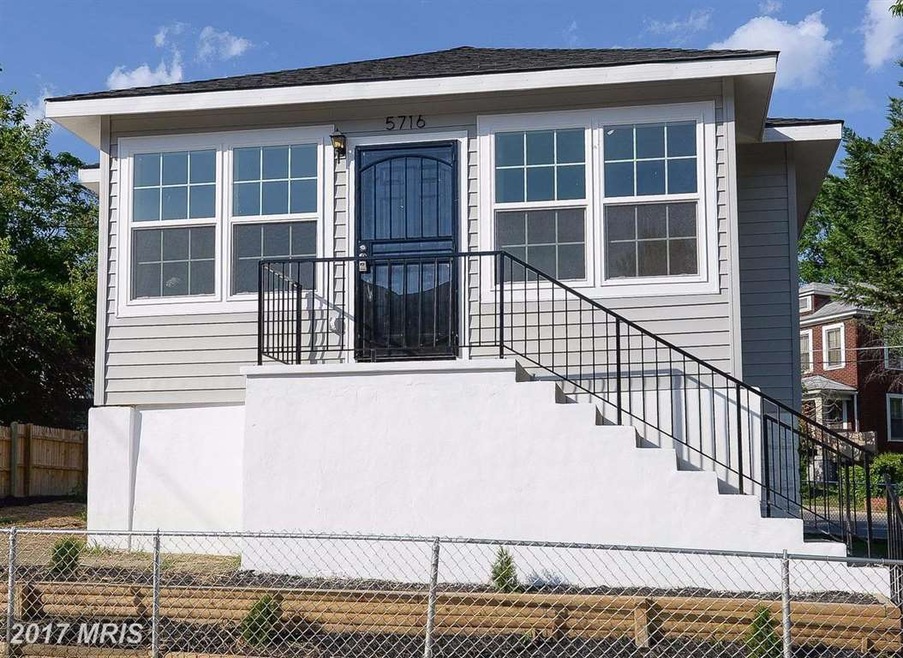
5716 Jost St Fairmount Heights, MD 20743
4
Beds
3
Baths
692
Sq Ft
6,050
Sq Ft Lot
Highlights
- No HOA
- Forced Air Heating and Cooling System
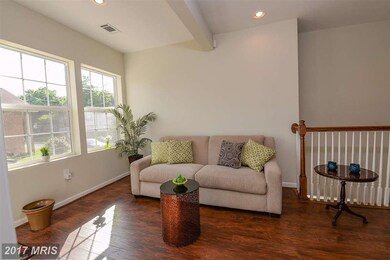
- Combination Dining and Living Room
- Kitchen Island
About This Home
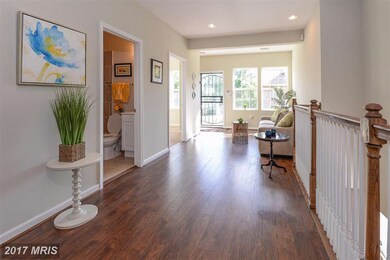
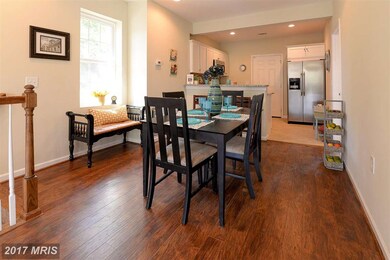
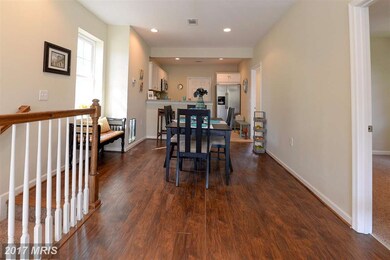
As of March 2022Uniquely Updated and renovated spacious single family house with yard space for any occasion. Gourmet style kitchen with granite, stainless steel appliances, additional recess lighting thru out, open floor plan with an enjoyable finish basement, on a reasonably sized corner lot.
Last Agent to Sell the Property
Brien Pollard
DIRECT ENTERPRISES LLC Listed on: 06/09/2017
Home Details
Home Type
- Single Family
Est. Annual Taxes
- $1,796
Year Built
- Built in 1924
Lot Details
- 6,050 Sq Ft Lot
- Property is zoned R55
Parking
- Off-Street Parking
Home Design
- Vinyl Siding
Interior Spaces
- Property has 2 Levels
- Combination Dining and Living Room
- Kitchen Island
Bedrooms and Bathrooms
- 4 Bedrooms | 3 Main Level Bedrooms
- 3 Full Bathrooms
Finished Basement
- Connecting Stairway
- Side Basement Entry
Schools
- Fairmont Heights High School
Utilities
- Forced Air Heating and Cooling System
- Electric Water Heater
Community Details
- No Home Owners Association
- West Fairmount Subdivision
Listing and Financial Details
- Tax Lot 16
- Assessor Parcel Number 17182093284
Ownership History
Date
Name
Owned For
Owner Type
Purchase Details
Listed on
Jun 9, 2017
Closed on
Aug 7, 2017
Sold by
Horizons Enterprises Llc
Bought by
Charles Faye P
Seller's Agent
Brien Pollard
DIRECT ENTERPRISES LLC
Buyer's Agent
Michael Johnson
United Real Estate HomeSource
List Price
$264,900
Sold Price
$260,000
Premium/Discount to List
-$4,900
-1.85%
Current Estimated Value
Home Financials for this Owner
Home Financials are based on the most recent Mortgage that was taken out on this home.
Estimated Appreciation
$135,390
Avg. Annual Appreciation
5.19%
Original Mortgage
$255,290
Interest Rate
3.75%
Mortgage Type
FHA
Purchase Details
Listed on
Oct 15, 2016
Closed on
Jan 19, 2017
Sold by
Tuner Posie and Tuner Elnora
Bought by
Horizons Enterprises Llc
Seller's Agent
Josephine Mourning
RE/MAX Professionals
Buyer's Agent
Josephine Mourning
RE/MAX Professionals
List Price
$72,000
Sold Price
$60,000
Premium/Discount to List
-$12,000
-16.67%
Home Financials for this Owner
Home Financials are based on the most recent Mortgage that was taken out on this home.
Avg. Annual Appreciation
1338.33%
Purchase Details
Closed on
Jan 22, 2016
Sold by
Princeg George County
Bought by
Turner Posie and Turner Elnora
Purchase Details
Closed on
Feb 16, 2006
Sold by
Banks Beatrice
Bought by
Carter Nathan
Purchase Details
Closed on
Feb 13, 2006
Sold by
Banks Beatrice
Bought by
Carter Nathan
Similar Home in Fairmount Heights, MD
Create a Home Valuation Report for This Property
The Home Valuation Report is an in-depth analysis detailing your home's value as well as a comparison with similar homes in the area
Home Values in the Area
Average Home Value in this Area
Purchase History
| Date | Type | Sale Price | Title Company |
|---|---|---|---|
| Deed | $260,000 | Gpn Title Inc | |
| Deed | $60,000 | First American Title Ins Co | |
| Public Action Common In Florida Clerks Tax Deed Or Tax Deeds Or Property Sold For Taxes | $46,000 | Attorney | |
| Deed | $140,000 | -- | |
| Deed | $140,000 | -- |
Source: Public Records
Mortgage History
| Date | Status | Loan Amount | Loan Type |
|---|---|---|---|
| Open | $245,464 | FHA | |
| Closed | $255,290 | FHA |
Source: Public Records
Property History
| Date | Event | Price | Change | Sq Ft Price |
|---|---|---|---|---|
| 03/31/2022 03/31/22 | Sold | $362,000 | +3.4% | $245 / Sq Ft |
| 02/27/2022 02/27/22 | Pending | -- | -- | -- |
| 02/16/2022 02/16/22 | For Sale | $350,000 | -3.3% | $237 / Sq Ft |
| 02/14/2022 02/14/22 | Off Market | $362,000 | -- | -- |
| 02/14/2022 02/14/22 | For Sale | $350,000 | 0.0% | $237 / Sq Ft |
| 12/01/2019 12/01/19 | Rented | $995 | 0.0% | -- |
| 11/22/2019 11/22/19 | Under Contract | -- | -- | -- |
| 11/05/2019 11/05/19 | For Rent | $995 | +2.1% | -- |
| 05/18/2018 05/18/18 | Rented | $975 | 0.0% | -- |
| 05/18/2018 05/18/18 | Under Contract | -- | -- | -- |
| 04/04/2018 04/04/18 | For Rent | $975 | 0.0% | -- |
| 08/07/2017 08/07/17 | Sold | $260,000 | -1.8% | $376 / Sq Ft |
| 07/17/2017 07/17/17 | Pending | -- | -- | -- |
| 07/05/2017 07/05/17 | Price Changed | $264,900 | 0.0% | $383 / Sq Ft |
| 07/05/2017 07/05/17 | For Sale | $264,900 | +1.9% | $383 / Sq Ft |
| 07/03/2017 07/03/17 | Off Market | $260,000 | -- | -- |
| 07/01/2017 07/01/17 | Price Changed | $269,900 | -1.8% | $390 / Sq Ft |
| 06/09/2017 06/09/17 | For Sale | $274,900 | 0.0% | $397 / Sq Ft |
| 06/01/2017 06/01/17 | Price Changed | $274,900 | +358.2% | $397 / Sq Ft |
| 01/17/2017 01/17/17 | Sold | $60,000 | -16.7% | $87 / Sq Ft |
| 12/20/2016 12/20/16 | Pending | -- | -- | -- |
| 12/09/2016 12/09/16 | For Sale | $72,000 | 0.0% | $104 / Sq Ft |
| 11/23/2016 11/23/16 | Pending | -- | -- | -- |
| 11/18/2016 11/18/16 | For Sale | $72,000 | 0.0% | $104 / Sq Ft |
| 11/02/2016 11/02/16 | Pending | -- | -- | -- |
| 11/02/2016 11/02/16 | For Sale | $72,000 | 0.0% | $104 / Sq Ft |
| 10/22/2016 10/22/16 | Pending | -- | -- | -- |
| 10/15/2016 10/15/16 | For Sale | $72,000 | -- | $104 / Sq Ft |
Source: Bright MLS
Tax History Compared to Growth
Tax History
| Year | Tax Paid | Tax Assessment Tax Assessment Total Assessment is a certain percentage of the fair market value that is determined by local assessors to be the total taxable value of land and additions on the property. | Land | Improvement |
|---|---|---|---|---|
| 2024 | $5,538 | $285,533 | $0 | $0 |
| 2023 | $4,932 | $253,000 | $65,400 | $187,600 |
| 2022 | $4,692 | $240,433 | $0 | $0 |
| 2021 | $9,384 | $227,867 | $0 | $0 |
| 2020 | $8,515 | $215,300 | $45,200 | $170,100 |
| 2019 | $3,122 | $172,600 | $0 | $0 |
| 2018 | $1,296 | $129,900 | $0 | $0 |
| 2017 | $1,796 | $87,200 | $0 | $0 |
| 2016 | -- | $83,167 | $0 | $0 |
| 2015 | -- | $79,133 | $0 | $0 |
| 2014 | $2,140 | $75,100 | $0 | $0 |
Source: Public Records
Agents Affiliated with this Home
-
Sarah Reynolds
Seller's Agent in 2022
Sarah Reynolds
Keller Williams Realty
(703) 844-3425
1 in this area
3,716 Total Sales
-
Damon Brockenberry
Buyer's Agent in 2022
Damon Brockenberry
Keller Williams Preferred Properties
(240) 694-6460
1 in this area
53 Total Sales
-
Rick Mubarak
Seller's Agent in 2019
Rick Mubarak
Samson Properties
(240) 339-3535
25 Total Sales
-
Derrick Bridgeforth
D
Buyer's Agent in 2019
Derrick Bridgeforth
Taylor Properties
(202) 758-6837
90 Total Sales
-
B
Seller's Agent in 2017
Brien Pollard
RE/MAX
-
Josephine Mourning
Seller's Agent in 2017
Josephine Mourning
RE/MAX
(301) 437-5254
1 in this area
52 Total Sales
Map
Source: Bright MLS
MLS Number: 1001099427
APN: 18-2093284
Disclaimer: Certain information contained herein is derived from information provided by parties other than Homes.com. All information provided is deemed reliable, but is not guaranteed to be accurate and should be independently verified.
![]() The data relating to real estate for sale on this website appears in part through the BRIGHT Internet Data Exchange program, a voluntary cooperative exchange of property listing data between licensed real estate brokerage firms, and is provided by BRIGHT through a licensing agreement.
The data relating to real estate for sale on this website appears in part through the BRIGHT Internet Data Exchange program, a voluntary cooperative exchange of property listing data between licensed real estate brokerage firms, and is provided by BRIGHT through a licensing agreement.
Listing information is from various brokers who participate in the Bright MLS IDX program and not all listings may be visible on the site.
The property information being provided on or through the website is for the personal, non-commercial use of consumers and such information may not be used for any purpose other than to identify prospective properties consumers may be interested in purchasing.
Some properties which appear for sale on the website may no longer be available because they are for instance, under contract, sold or are no longer being offered for sale.
Property information displayed is deemed reliable but is not guaranteed.
Copyright 2025 Bright MLS, Inc.
Nearby Homes
- 5711 J St
- 833 Eastern Ave
- 5613 J St
- 711 Eastern Ave NE
- 908 59th Ave
- 1023 58th Ave
- 5710 Kolb St
- 5613 Kolb St
- 706 59th Ave
- 703 59th Ave
- 5904 K St
- 713 59th Place
- 5909 K St
- Lot #1,2,3,843 &5 Field Place NE
- 5818 lot 813,811,007 Field Place NE
- 0 Kolb St
- 5505 Hayes St NE
- 5906 L St
- 5428 Hunt Place NE
- 5405 James Place NE