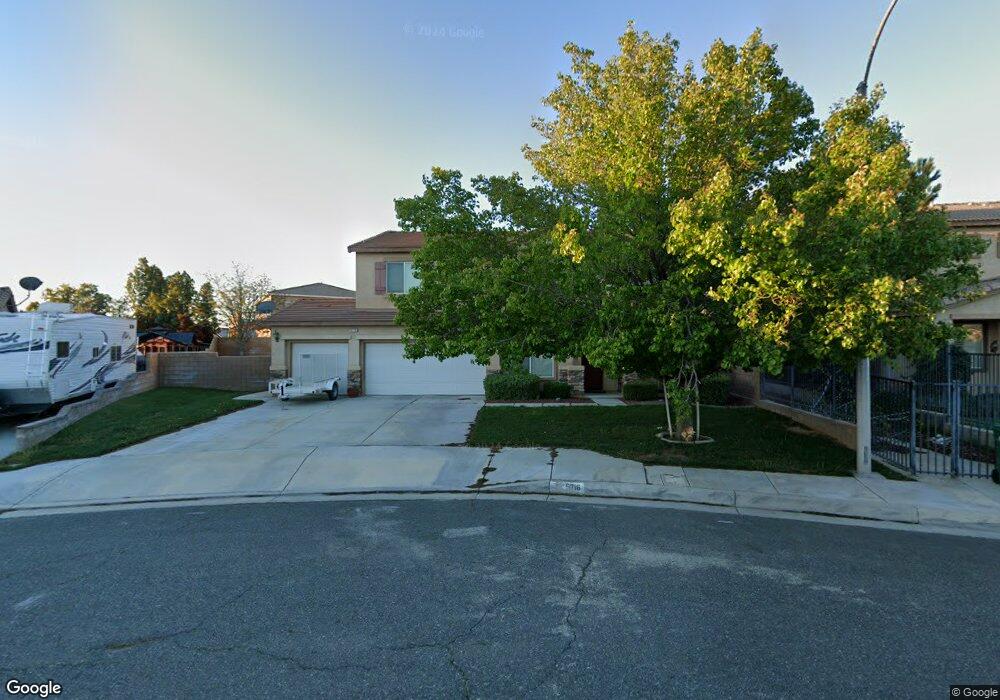
5716 W Avenue j13 Lancaster, CA 93536
West Lancaster NeighborhoodEstimated Value: $575,000 - $621,000
5
Beds
4
Baths
3,090
Sq Ft
$194/Sq Ft
Est. Value
About This Home
This home is located at 5716 W Avenue j13, Lancaster, CA 93536 and is currently estimated at $599,089, approximately $193 per square foot. 5716 W Avenue j13 is a home located in Los Angeles County with nearby schools including Sundown Elementary School, Lancaster High School, and Fabunni Private School Inc..
Ownership History
Date
Name
Owned For
Owner Type
Purchase Details
Closed on
Dec 27, 2010
Sold by
Perkins Nicole
Bought by
Perkins Shannon L
Current Estimated Value
Home Financials for this Owner
Home Financials are based on the most recent Mortgage that was taken out on this home.
Original Mortgage
$219,296
Outstanding Balance
$154,013
Interest Rate
5.5%
Mortgage Type
FHA
Estimated Equity
$445,076
Purchase Details
Closed on
Dec 15, 2010
Sold by
Cook James A and Cook Veronica M
Bought by
Perkins Shannon L
Home Financials for this Owner
Home Financials are based on the most recent Mortgage that was taken out on this home.
Original Mortgage
$219,296
Outstanding Balance
$154,013
Interest Rate
5.5%
Mortgage Type
FHA
Estimated Equity
$445,076
Purchase Details
Closed on
Jul 20, 2005
Sold by
K Hovnanian Forecast Homes Inc
Bought by
Cook James A and Cook Veronica M
Home Financials for this Owner
Home Financials are based on the most recent Mortgage that was taken out on this home.
Original Mortgage
$363,900
Interest Rate
5.72%
Mortgage Type
Fannie Mae Freddie Mac
Create a Home Valuation Report for This Property
The Home Valuation Report is an in-depth analysis detailing your home's value as well as a comparison with similar homes in the area
Home Values in the Area
Average Home Value in this Area
Purchase History
| Date | Buyer | Sale Price | Title Company |
|---|---|---|---|
| Perkins Shannon L | -- | Chicago Title Company | |
| Perkins Shannon L | $225,000 | Chicago Title Company | |
| Cook James A | $455,000 | -- |
Source: Public Records
Mortgage History
| Date | Status | Borrower | Loan Amount |
|---|---|---|---|
| Open | Perkins Shannon L | $219,296 | |
| Previous Owner | Cook James A | $363,900 |
Source: Public Records
Tax History Compared to Growth
Tax History
| Year | Tax Paid | Tax Assessment Tax Assessment Total Assessment is a certain percentage of the fair market value that is determined by local assessors to be the total taxable value of land and additions on the property. | Land | Improvement |
|---|---|---|---|---|
| 2025 | $4,998 | $288,254 | $71,741 | $216,513 |
| 2024 | $4,998 | $282,603 | $70,335 | $212,268 |
| 2023 | $4,946 | $277,062 | $68,956 | $208,106 |
| 2022 | $4,733 | $271,630 | $67,604 | $204,026 |
| 2021 | $4,312 | $266,305 | $66,279 | $200,026 |
| 2019 | $4,208 | $258,408 | $64,314 | $194,094 |
| 2018 | $4,049 | $253,342 | $63,053 | $190,289 |
| 2016 | $3,827 | $243,505 | $60,605 | $182,900 |
| 2015 | $3,786 | $239,848 | $59,695 | $180,153 |
| 2014 | $3,767 | $235,151 | $58,526 | $176,625 |
Source: Public Records
Map
Nearby Homes
- 5651 W Avenue j15
- 5833 W Avenue j13
- 0 W Avenue K Unit SR25161579
- 0 W Avenue K Unit CV24074666
- 43869 Hampton St
- 5806 W Avenue k3
- 6120 W J13
- 6120 W Avenue j15
- 0 53rd St W and Ave J11
- 6118 W Avenue J 9
- 6138 W Avenue k1
- 0 Vac Cor Ave K4 85th
- 6223 W Avenue j12
- 0 61st St W
- 43342 Harbor St
- 0 60 Th St W & Ave J-6 Unit 25005111
- 0 W Vic Avenue J6 58th St W Unit 25005682
- 6304 Starview Dr
- 6147 W Avenue k6
- 0 50th St West and Avenue K Unit 23008524
- 5715 W Avenue j14
- 43728 57th St W
- 5726 W Avenue j13
- 5711 W Avenue j14
- 5725 W Avenue j14
- 43736 57th St W
- 5732 W Avenue j13
- 43739 57th St W
- 5733 W Avenue j14
- 43704 57th St W
- 43719 Verella Ct
- 43711 Verella Ct
- 43744 57th St W
- 43745 57th St W
- 5740 W Avenue j13
- 43703 Verella Ct
- 43738 Sondi Dr
- 5739 W Avenue j14
- 5722 W Avenue j14
- 43658 57th St W