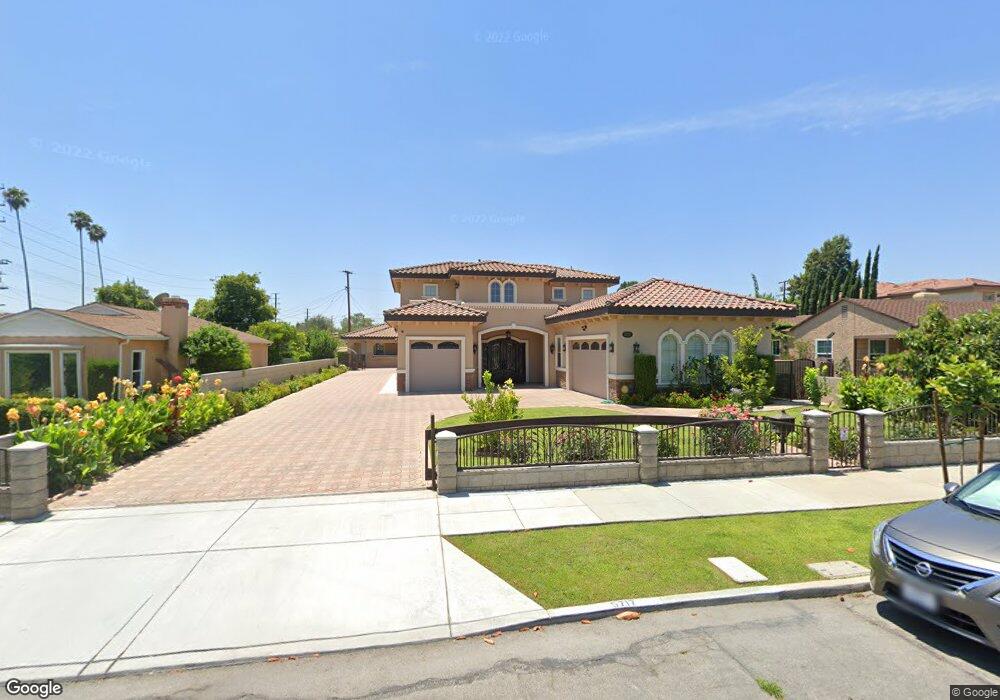
5717 Primrose Ave Temple City, CA 91780
Estimated Value: $1,642,000 - $2,669,904
5
Beds
6
Baths
4,043
Sq Ft
$516/Sq Ft
Est. Value
About This Home
This home is located at 5717 Primrose Ave, Temple City, CA 91780 and is currently estimated at $2,086,226, approximately $516 per square foot. 5717 Primrose Ave is a home located in Los Angeles County with nearby schools including La Rosa Elementary, Oak Avenue Intermediate School, and Temple City High School.
Ownership History
Date
Name
Owned For
Owner Type
Purchase Details
Closed on
Sep 15, 2023
Sold by
Miu Annie
Bought by
Cai And Miu Family Trust and Miu
Current Estimated Value
Purchase Details
Closed on
Jul 9, 2013
Sold by
Pang Song Bo Cai
Bought by
Miu Wai Ying
Home Financials for this Owner
Home Financials are based on the most recent Mortgage that was taken out on this home.
Original Mortgage
$474,000
Interest Rate
4.75%
Mortgage Type
Adjustable Rate Mortgage/ARM
Purchase Details
Closed on
Apr 21, 2004
Sold by
Wongthavatchai Varoon and Wongthavatchai Nitaya
Bought by
Wongthavatchai Varoon and Wongthavatchai Nitaya
Purchase Details
Closed on
Jun 14, 1995
Sold by
Vancleve Sharon M
Bought by
Wongthavatchai Varoon and Wongthavatchai Nitaya
Home Financials for this Owner
Home Financials are based on the most recent Mortgage that was taken out on this home.
Original Mortgage
$203,150
Interest Rate
7.74%
Create a Home Valuation Report for This Property
The Home Valuation Report is an in-depth analysis detailing your home's value as well as a comparison with similar homes in the area
Home Values in the Area
Average Home Value in this Area
Purchase History
| Date | Buyer | Sale Price | Title Company |
|---|---|---|---|
| Cai And Miu Family Trust | -- | None Listed On Document | |
| Miu Wai Ying | -- | Pacific Coast Title Company | |
| Miu Wai Ying | $790,000 | Pacific Coast Title Company | |
| Wongthavatchai Varoon | -- | -- | |
| Wongthavatchai Varoon | $270,000 | Guardian Title Company |
Source: Public Records
Mortgage History
| Date | Status | Borrower | Loan Amount |
|---|---|---|---|
| Previous Owner | Miu Wai Ying | $474,000 | |
| Previous Owner | Wongthavatchai Varoon | $203,150 |
Source: Public Records
Tax History Compared to Growth
Tax History
| Year | Tax Paid | Tax Assessment Tax Assessment Total Assessment is a certain percentage of the fair market value that is determined by local assessors to be the total taxable value of land and additions on the property. | Land | Improvement |
|---|---|---|---|---|
| 2025 | $20,896 | $1,805,887 | $968,424 | $837,463 |
| 2024 | $20,896 | $1,770,479 | $949,436 | $821,043 |
| 2023 | $20,422 | $1,735,765 | $930,820 | $804,945 |
| 2022 | $19,086 | $1,701,731 | $912,569 | $789,162 |
| 2021 | $19,452 | $1,668,365 | $894,676 | $773,689 |
| 2020 | $19,174 | $1,651,259 | $885,503 | $765,756 |
| 2019 | $18,742 | $1,618,883 | $868,141 | $750,742 |
| 2018 | $16,611 | $1,455,571 | $851,119 | $604,452 |
Source: Public Records
Map
Nearby Homes
- 9459 Workman Ave
- 5716 Alessandro Ave
- 5530 Alessandro Ave
- 9720 Live Oak Ave
- 5929 Oak Ave
- 9409 Olive St
- 6037 Oak Ave
- 5327 Buttons Ave
- 5635 Noel Dr
- 6119 Temple City Blvd
- 0 Sultana Ave
- 9711 Garibaldi Ave
- 5619 Sultana Ave Unit A
- 5819 Baldwin Ave Unit C
- 6226 Primrose Ave
- 6204 Oak Ave
- 5823 Myda Ave
- 5463 Sultana Ave
- 6022 Rowland Ave
- 5032 Fiesta Ave
- 5723 Primrose Ave
- 9521 Live Oak Ave
- 5703 Primrose Ave
- 5731 Primrose Ave
- 5718 Cloverly Ave
- 9515 Live Oak Ave
- 5720 Cloverly Ave
- 5735 Primrose Ave
- 5706 Cloverly Ave
- 5724 Cloverly Ave
- 5720 Primrose Ave
- 5730 Cloverly Ave
- 5741 Primrose Ave
- 5700 Primrose Ave
- 5714 Primrose Ave
- 5710 Primrose Ave
- 5702 Cloverly Ave
- 5734 Cloverly Ave
- 5730 Primrose Ave
- 5722 Primrose Ave