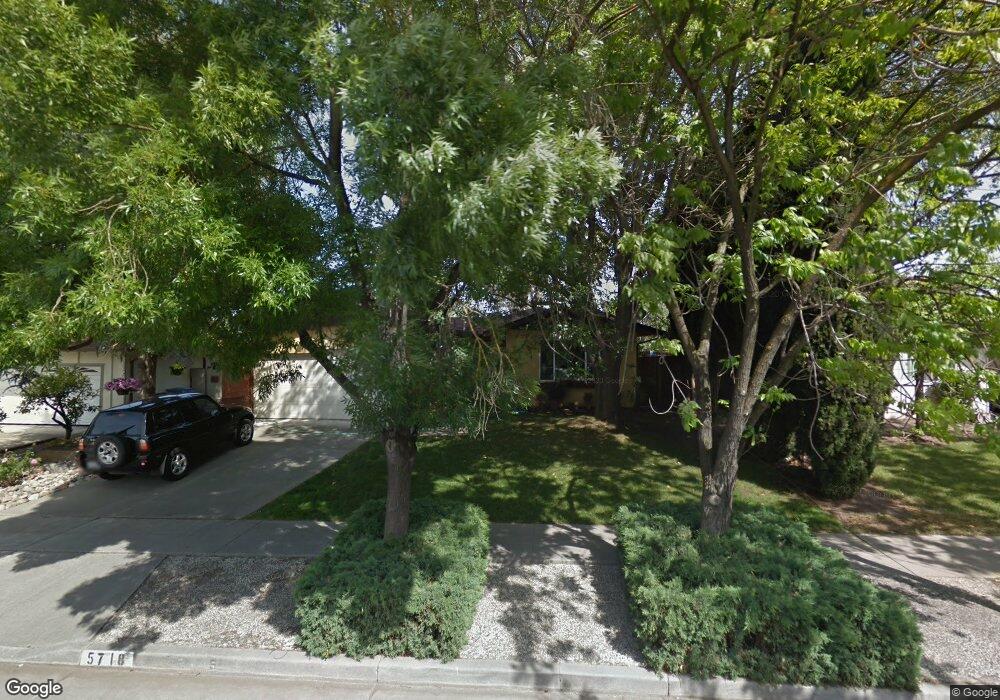
5718 San Lorenzo Dr San Jose, CA 95123
McKuen NeighborhoodEstimated Value: $1,343,000 - $1,467,000
3
Beds
2
Baths
1,278
Sq Ft
$1,099/Sq Ft
Est. Value
About This Home
This home is located at 5718 San Lorenzo Dr, San Jose, CA 95123 and is currently estimated at $1,403,922, approximately $1,098 per square foot. 5718 San Lorenzo Dr is a home located in Santa Clara County with nearby schools including Allen at Steinbeck, Castillero Middle School, and Gunderson High School.
Ownership History
Date
Name
Owned For
Owner Type
Purchase Details
Closed on
Apr 23, 2015
Sold by
Nielsen Carter L and Roehrkasse Eva L
Bought by
Nielsen Carter L and Roehrkasse Eva L
Current Estimated Value
Home Financials for this Owner
Home Financials are based on the most recent Mortgage that was taken out on this home.
Original Mortgage
$546,500
Outstanding Balance
$420,553
Interest Rate
3.73%
Mortgage Type
New Conventional
Estimated Equity
$983,369
Purchase Details
Closed on
Feb 23, 2006
Sold by
Marler Darrell J
Bought by
Nielsen Carter L and Nielsen Eva L Roehrkasse
Home Financials for this Owner
Home Financials are based on the most recent Mortgage that was taken out on this home.
Original Mortgage
$98,100
Interest Rate
6.04%
Mortgage Type
Stand Alone Second
Purchase Details
Closed on
Jul 16, 1996
Sold by
Magleby Jean S and Magleby Jeanean
Bought by
Magleby Jean S
Create a Home Valuation Report for This Property
The Home Valuation Report is an in-depth analysis detailing your home's value as well as a comparison with similar homes in the area
Home Values in the Area
Average Home Value in this Area
Purchase History
| Date | Buyer | Sale Price | Title Company |
|---|---|---|---|
| Nielsen Carter L | -- | Cornerstone Title Company | |
| Nielsen Carter L | $654,000 | Alliance Title Company | |
| Magleby Jean S | -- | -- |
Source: Public Records
Mortgage History
| Date | Status | Borrower | Loan Amount |
|---|---|---|---|
| Open | Nielsen Carter L | $546,500 | |
| Closed | Nielsen Carter L | $98,100 | |
| Closed | Nielsen Carter L | $523,200 |
Source: Public Records
Tax History Compared to Growth
Tax History
| Year | Tax Paid | Tax Assessment Tax Assessment Total Assessment is a certain percentage of the fair market value that is determined by local assessors to be the total taxable value of land and additions on the property. | Land | Improvement |
|---|---|---|---|---|
| 2025 | $12,368 | $893,730 | $683,285 | $210,445 |
| 2024 | $12,368 | $876,207 | $669,888 | $206,319 |
| 2023 | $12,116 | $859,027 | $656,753 | $202,274 |
| 2022 | $11,982 | $842,184 | $643,876 | $198,308 |
| 2021 | $11,697 | $825,671 | $631,251 | $194,420 |
| 2020 | $11,362 | $817,206 | $624,779 | $192,427 |
| 2019 | $11,088 | $801,183 | $612,529 | $188,654 |
| 2018 | $10,958 | $785,474 | $600,519 | $184,955 |
| 2017 | $10,861 | $770,074 | $588,745 | $181,329 |
| 2016 | $9,852 | $688,000 | $525,900 | $162,100 |
| 2015 | $9,217 | $638,000 | $487,800 | $150,200 |
| 2014 | -- | $608,000 | $464,800 | $143,200 |
Source: Public Records
Map
Nearby Homes
- 5629 Morton Way
- 5749 San Lorenzo Dr
- 5660 Calmor Ave Unit 4
- 5571 Sunny Oaks Dr
- 5629 Playa Del Rey Ct Unit 3
- 5707 Calmor Ave Unit 3
- 5683 Playa Del Rey Unit 1
- 734 Pronto Dr
- 5697 Chesbro Ave
- 5510 Dunsburry Way
- 5870 Cabral Ave
- 5850 Chesbro Ave
- 469 Velasco Dr
- 5986 Loma Prieta Dr
- 5455 Don Mateo Ct
- 5806 Blossom Ave
- 845 Villa Teresa Way Unit 845
- 729 Calero Ave
- 5841 Blossom Ave
- 5439 Colony Green Dr
- 5722 San Lorenzo Dr
- 5714 San Lorenzo Dr
- 749 Cahalan Ct
- 746 Cahalan Ct
- 745 Cahalan Ct
- 5696 San Lorenzo Dr
- 5719 San Lorenzo Dr
- 5723 San Lorenzo Dr
- 5717 San Lorenzo Dr
- 5730 San Lorenzo Dr
- 5692 San Lorenzo Dr
- 5727 San Lorenzo Dr
- 5711 San Lorenzo Dr
- 740 Cahalan Ct
- 745 Chemeketa Ct
- 0 Oakridge Rd Unit ML81242196
- 5686 San Lorenzo Dr
- 741 Cahalan Ct
- 5731 San Lorenzo Dr
- 5734 San Lorenzo Dr