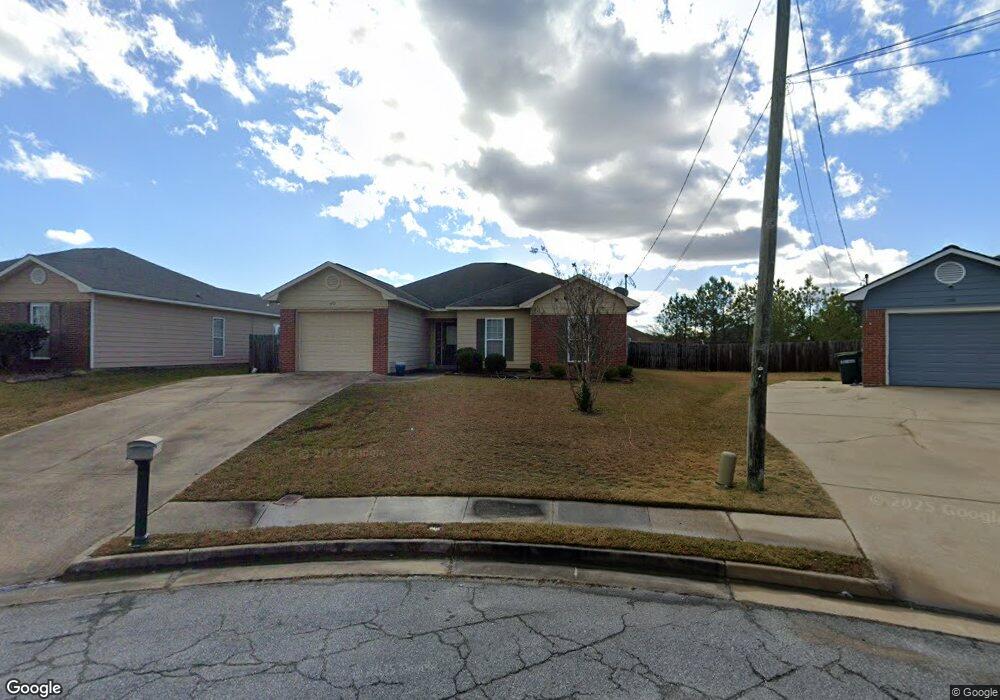
5719 Boby Dr Columbus, GA 31907
East Columbus NeighborhoodEstimated Value: $168,000 - $177,975
3
Beds
2
Baths
1,459
Sq Ft
$119/Sq Ft
Est. Value
About This Home
This home is located at 5719 Boby Dr, Columbus, GA 31907 and is currently estimated at $172,994, approximately $118 per square foot. 5719 Boby Dr is a home located in Muscogee County with nearby schools including Forrest Road Elementary School, Fort Middle School, and Kendrick High School.
Ownership History
Date
Name
Owned For
Owner Type
Purchase Details
Closed on
Jan 4, 2013
Sold by
Lowe Sophia L
Bought by
Lopez Rufina
Current Estimated Value
Purchase Details
Closed on
Jan 5, 2011
Sold by
Fannie Mae
Bought by
Davis Norma J
Home Financials for this Owner
Home Financials are based on the most recent Mortgage that was taken out on this home.
Original Mortgage
$87,755
Interest Rate
4.4%
Mortgage Type
FHA
Purchase Details
Closed on
Jul 6, 2010
Sold by
Wells Fargo Bank Na
Bought by
Federal National Mortgage Association
Purchase Details
Closed on
Mar 20, 2007
Sold by
Woodruff Contracting Co Llc
Bought by
Norman Anthony D
Home Financials for this Owner
Home Financials are based on the most recent Mortgage that was taken out on this home.
Original Mortgage
$154,900
Interest Rate
6.22%
Mortgage Type
Purchase Money Mortgage
Create a Home Valuation Report for This Property
The Home Valuation Report is an in-depth analysis detailing your home's value as well as a comparison with similar homes in the area
Home Values in the Area
Average Home Value in this Area
Purchase History
| Date | Buyer | Sale Price | Title Company |
|---|---|---|---|
| Lopez Rufina | -- | -- | |
| Lopez Rufina | -- | -- | |
| Lopez Rufina | -- | -- | |
| Lopez Rufina | -- | -- | |
| Davis Norma J | $98,000 | None Available | |
| Federal National Mortgage Association | -- | None Available | |
| Wells Fargo Bank Na | $185,260 | None Available | |
| Norman Anthony D | $154,900 | None Available |
Source: Public Records
Mortgage History
| Date | Status | Borrower | Loan Amount |
|---|---|---|---|
| Previous Owner | Davis Norma J | $87,755 | |
| Previous Owner | Norman Anthony D | $154,900 |
Source: Public Records
Tax History
| Year | Tax Paid | Tax Assessment Tax Assessment Total Assessment is a certain percentage of the fair market value that is determined by local assessors to be the total taxable value of land and additions on the property. | Land | Improvement |
|---|---|---|---|---|
| 2025 | $2,574 | $65,764 | $9,616 | $56,148 |
| 2024 | $2,574 | $65,764 | $9,616 | $56,148 |
| 2023 | $259 | $65,764 | $9,616 | $56,148 |
| 2022 | $2,301 | $56,360 | $9,616 | $46,744 |
| 2021 | $1,729 | $42,348 | $9,616 | $32,732 |
| 2020 | $1,730 | $42,348 | $9,616 | $32,732 |
| 2019 | $1,735 | $42,348 | $9,616 | $32,732 |
| 2018 | $1,735 | $42,348 | $9,616 | $32,732 |
| 2017 | $1,741 | $42,348 | $9,616 | $32,732 |
| 2016 | $2,214 | $53,680 | $9,360 | $44,320 |
| 2015 | $2,217 | $53,680 | $9,360 | $44,320 |
| 2014 | $2,220 | $53,680 | $9,360 | $44,320 |
| 2013 | -- | $53,680 | $9,360 | $44,320 |
Source: Public Records
Map
Nearby Homes
- 6834 Aldora Dr
- 6946 Boby Ct
- 5644 Peggy Dr
- 5646 Boby Dr
- 6703 Aldora Dr
- 6636 Foxboro Dr
- 2735 Schatulga Rd
- 2737 Schatulga Rd
- 3041 Waddell Dr
- 2708 Courtland Ave
- 6424 Lemongrass Dr
- 6374 Lemongrass Dr
- 6370 Lemongrass Dr
- 6362 Lemongrass Dr
- 2143 Hunter Ct
- 2672 Honeysuckle Dr
- 3301 Musket Dr
- 2312 Burnside Dr
- 6311 Morning Dew Dr
- 6303 Morning Dew Dr
Your Personal Tour Guide
Ask me questions while you tour the home.