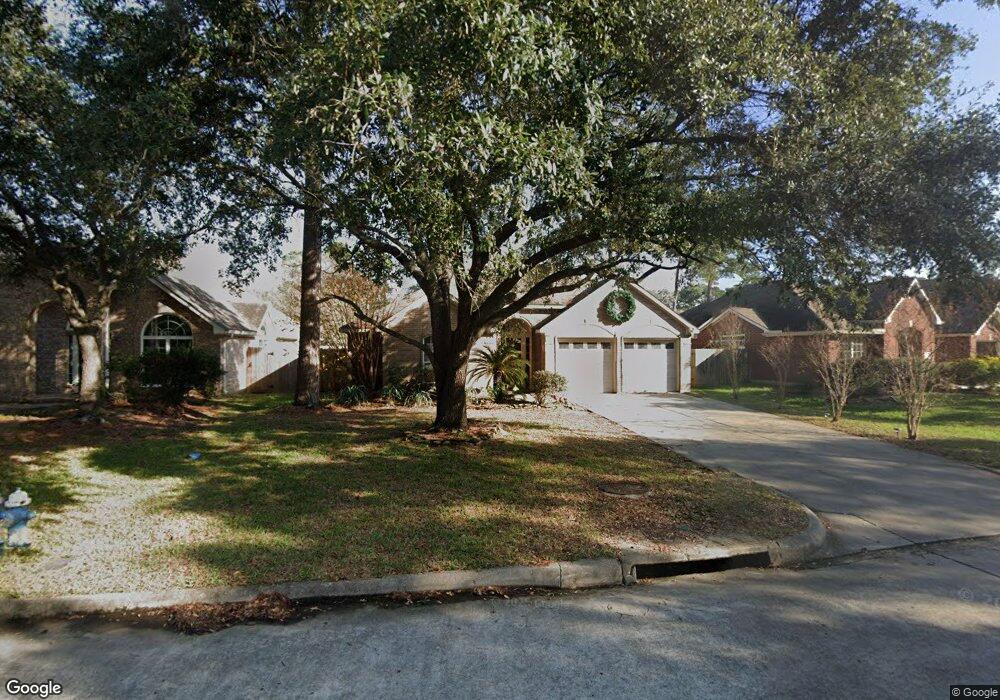
5719 Capella Park Dr Unit 1 Spring, TX 77379
Estimated Value: $303,751 - $353,000
3
Beds
2
Baths
2,029
Sq Ft
$164/Sq Ft
Est. Value
About This Home
This home is located at 5719 Capella Park Dr Unit 1, Spring, TX 77379 and is currently estimated at $332,188, approximately $163 per square foot. 5719 Capella Park Dr Unit 1 is a home located in Harris County with nearby schools including Benignus Elementary School, Krimmel Intermediate School, and Klein Oak High School.
Ownership History
Date
Name
Owned For
Owner Type
Purchase Details
Closed on
Sep 30, 2005
Sold by
Williams Eugene and Williams Tomasyne
Bought by
Ahrabi David H
Current Estimated Value
Home Financials for this Owner
Home Financials are based on the most recent Mortgage that was taken out on this home.
Original Mortgage
$115,900
Outstanding Balance
$62,035
Interest Rate
5.76%
Mortgage Type
Fannie Mae Freddie Mac
Estimated Equity
$270,153
Purchase Details
Closed on
Nov 15, 2004
Sold by
Christian David R
Bought by
Williams Eugene and Williams Tomasyne
Purchase Details
Closed on
Jun 8, 1999
Sold by
Emerald Builders Ltd
Bought by
Scofield Lynn Y
Home Financials for this Owner
Home Financials are based on the most recent Mortgage that was taken out on this home.
Original Mortgage
$109,950
Interest Rate
6.92%
Purchase Details
Closed on
Aug 31, 1998
Sold by
Pinelakes Ltd Partnership
Bought by
Emerald Builders Ltd
Create a Home Valuation Report for This Property
The Home Valuation Report is an in-depth analysis detailing your home's value as well as a comparison with similar homes in the area
Home Values in the Area
Average Home Value in this Area
Purchase History
| Date | Buyer | Sale Price | Title Company |
|---|---|---|---|
| Ahrabi David H | -- | Stewart Title Houston Div | |
| Williams Eugene | -- | Stewart Title Houston Div | |
| Scofield Lynn Y | -- | Principal Title | |
| Emerald Builders Ltd | -- | -- |
Source: Public Records
Mortgage History
| Date | Status | Borrower | Loan Amount |
|---|---|---|---|
| Open | Ahrabi David H | $115,900 | |
| Previous Owner | Scofield Lynn Y | $109,950 |
Source: Public Records
Tax History Compared to Growth
Tax History
| Year | Tax Paid | Tax Assessment Tax Assessment Total Assessment is a certain percentage of the fair market value that is determined by local assessors to be the total taxable value of land and additions on the property. | Land | Improvement |
|---|---|---|---|---|
| 2025 | $6,550 | $298,518 | $61,914 | $236,604 |
| 2024 | $6,550 | $282,788 | $61,914 | $220,874 |
| 2023 | $6,550 | $338,490 | $61,914 | $276,576 |
| 2022 | $6,531 | $261,265 | $61,914 | $199,351 |
| 2021 | $5,784 | $216,108 | $46,970 | $169,138 |
| 2020 | $5,861 | $206,465 | $46,970 | $159,495 |
| 2019 | $6,089 | $207,202 | $46,970 | $160,232 |
| 2018 | $2,718 | $190,100 | $34,160 | $155,940 |
| 2017 | $6,071 | $206,295 | $34,160 | $172,135 |
| 2016 | $6,180 | $210,000 | $34,160 | $175,840 |
| 2015 | $5,194 | $203,667 | $34,160 | $169,507 |
| 2014 | $5,194 | $180,893 | $34,160 | $146,733 |
Source: Public Records
Map
Nearby Homes
- 5926 Capella Park Dr
- 20251 Eden Pines
- 5618 Conica Ct
- 5822 Pinellas Park
- 5018 Mossy Bridge Dr
- 5227 Aberton Ln
- 5810 Sequoia Trace Ct
- 5718 Oakmoss Trail
- 4943 Bridgemont Ln
- 19623 Westbridge Ln
- 5211 Rivertree Ln
- 21102 Fernhollow Ln
- 5515 Pimberton Ln
- 5714 Brookway Willow Dr
- 20931 Fernhollow Ln
- 5522 Rivertree Ln
- 4722 Enchanted Rock Ln
- 19734 Plymouth Ridge Ln
- 21022 Waymare Ln
- 21215 Verdecove Ln
- 5719 Capella Park Dr
- 5715 Capella Park Dr
- 20123 Fallentimber Ct
- 5707 Capella Park Dr
- 20119 Fallentimber Ct
- 5731 Capella Park Dr
- 20127 Fallentimber Ct
- 5703 Capella Park Dr
- 5718 Capella Park Dr
- 5714 Capella Park Dr
- 20131 Fallentimber Ct
- 5803 Capella Park Dr
- 5722 Capella Park Dr
- 20115 Fallentimber Ct
- 5710 Capella Park Dr
- 5726 Capella Park Dr
- 5706 Capella Park Dr
- 5631 Capella Park Dr
- 5807 Capella Park Dr
- 20135 Fallentimber Ct