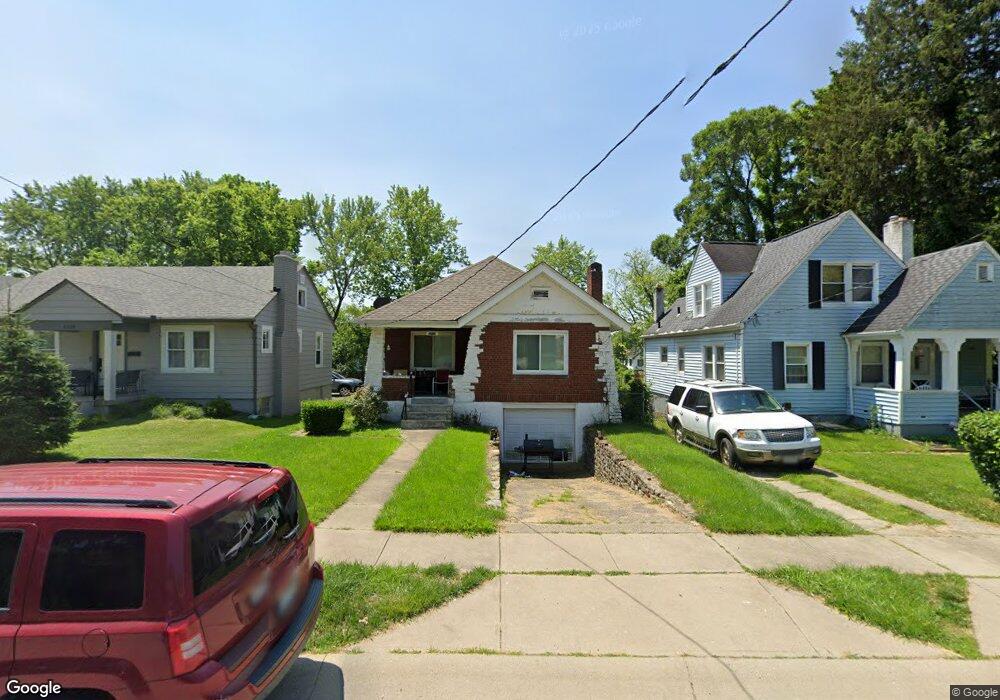
5719 Monning Place Cincinnati, OH 45227
Madisonville NeighborhoodEstimated Value: $150,000 - $189,874
2
Beds
1
Bath
948
Sq Ft
$188/Sq Ft
Est. Value
About This Home
This home is located at 5719 Monning Place, Cincinnati, OH 45227 and is currently estimated at $177,969, approximately $187 per square foot. 5719 Monning Place is a home located in Hamilton County with nearby schools including John P. Parker School, Shroder High School, and Clark Montessori High School.
Ownership History
Date
Name
Owned For
Owner Type
Purchase Details
Closed on
Aug 5, 2024
Sold by
Jackson Stanley Eugene and Jackson Jeanette
Bought by
Jackson Deaundre L
Current Estimated Value
Home Financials for this Owner
Home Financials are based on the most recent Mortgage that was taken out on this home.
Original Mortgage
$155,200
Outstanding Balance
$153,471
Interest Rate
6.95%
Mortgage Type
New Conventional
Estimated Equity
$24,498
Purchase Details
Closed on
Mar 17, 2000
Sold by
Edward Marshall
Bought by
Jackson Stanley and Jackson Barbara J
Home Financials for this Owner
Home Financials are based on the most recent Mortgage that was taken out on this home.
Original Mortgage
$29,100
Interest Rate
8.43%
Purchase Details
Closed on
Jan 29, 1999
Sold by
Edward Marshall and Edward O
Bought by
Marshall Edward and Estate Of Willa Mrashall
Create a Home Valuation Report for This Property
The Home Valuation Report is an in-depth analysis detailing your home's value as well as a comparison with similar homes in the area
Home Values in the Area
Average Home Value in this Area
Purchase History
| Date | Buyer | Sale Price | Title Company |
|---|---|---|---|
| Jackson Deaundre L | $160,000 | None Listed On Document | |
| Jackson Deaundre L | $160,000 | None Listed On Document | |
| Jackson Stanley | $30,000 | -- | |
| Marshall Edward | -- | -- |
Source: Public Records
Mortgage History
| Date | Status | Borrower | Loan Amount |
|---|---|---|---|
| Open | Jackson Deaundre L | $155,200 | |
| Closed | Jackson Deaundre L | $155,200 | |
| Previous Owner | Jackson Stanley | $29,100 |
Source: Public Records
Tax History Compared to Growth
Tax History
| Year | Tax Paid | Tax Assessment Tax Assessment Total Assessment is a certain percentage of the fair market value that is determined by local assessors to be the total taxable value of land and additions on the property. | Land | Improvement |
|---|---|---|---|---|
| 2024 | $1,789 | $27,304 | $4,092 | $23,212 |
| 2023 | $1,791 | $27,304 | $4,092 | $23,212 |
| 2022 | $1,462 | $18,579 | $3,441 | $15,138 |
| 2021 | $1,455 | $18,579 | $3,441 | $15,138 |
| 2020 | $750 | $18,579 | $3,441 | $15,138 |
| 2019 | $708 | $17,045 | $3,157 | $13,888 |
| 2018 | $709 | $17,045 | $3,157 | $13,888 |
| 2017 | $672 | $17,045 | $3,157 | $13,888 |
| 2016 | $299 | $12,586 | $3,045 | $9,541 |
| 2015 | $282 | $12,586 | $3,045 | $9,541 |
| 2014 | $276 | $12,586 | $3,045 | $9,541 |
| 2013 | $270 | $12,461 | $3,014 | $9,447 |
Source: Public Records
Map
Nearby Homes
- 5439 Whetsel Ave
- 5899 Jordan Ln
- 5424 Ward St
- 5330 Whetsel Ave
- 5317 Whetsel Ave
- 5610 Chandler St
- 5312 Dora St
- 5619 Chandler St
- 5454 Owasco St
- 5900 Woodland Ln
- 5521 Chandler St
- 5103 Ebersole Ave
- 5620 Windridge View Unit 32
- Phase 2 5918 Plan at Woodland Vistas
- Phase 2 5912 Plan at Woodland Vistas
- 5960 Woodland Ln
- 5123 Stewart Ave
- 5906 Woodland Ln
- 6229 Alpha St
- 5801 Hickory Ct Unit 1
- 5715 Monning Place
- 5723 Monning Place
- 5727 Monning Place
- 5731 Monning Place
- 5710 Luhn Ave
- 5708 Luhn Ave
- 5712 Luhn Ave
- 5735 Monning Place
- 5707 Monning Place
- 5724 Luhn Ave
- 5702 Luhn Ave
- 5710 Monning Place
- 5708 Monning Place
- 5712 Monning Place
- 5521 Ravenna St
- 5706 Monning Place
- 5796 Monning Place
- 5730 Luhn Ave
- 5700 Luhn Ave
- 5704 Monning Place