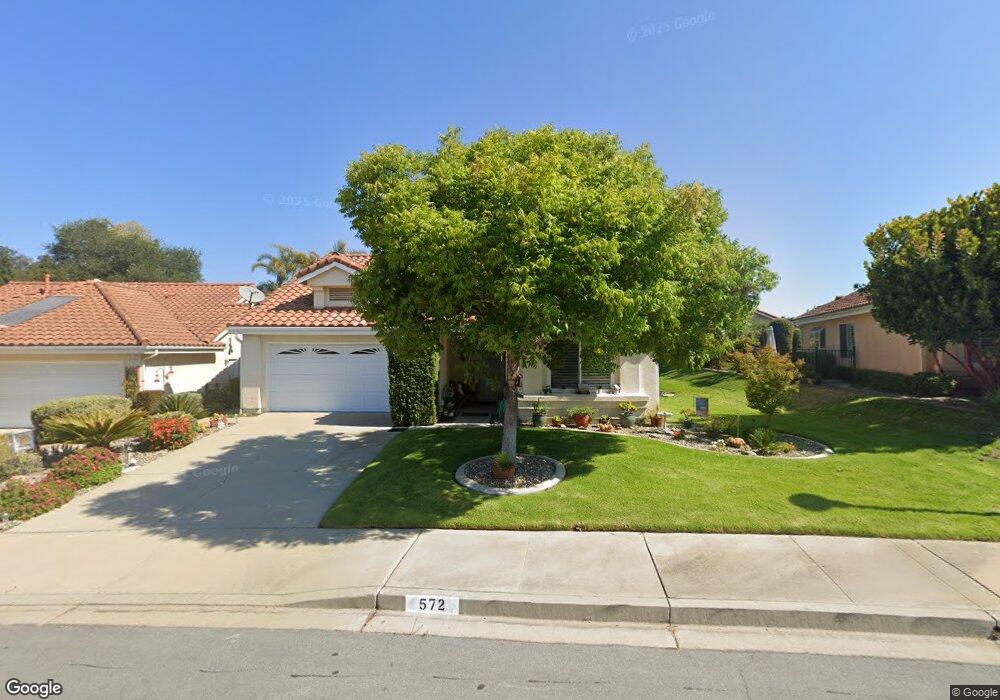
572 Masters Cir Nipomo, CA 93444
Blacklake NeighborhoodEstimated Value: $700,000 - $781,000
2
Beds
2
Baths
1,468
Sq Ft
$508/Sq Ft
Est. Value
About This Home
This home is located at 572 Masters Cir, Nipomo, CA 93444 and is currently estimated at $745,812, approximately $508 per square foot. 572 Masters Cir is a home located in San Luis Obispo County with nearby schools including Dorothea Lange Elementary School, Mesa Middle School, and Nipomo High School.
Ownership History
Date
Name
Owned For
Owner Type
Purchase Details
Closed on
Jul 14, 2011
Sold by
Ast Kenneth R and Ast Frances A
Bought by
The Kenneth Ray Ast & Frances Avo Ast Jo and Ast Kenneth Rau
Current Estimated Value
Purchase Details
Closed on
Jul 22, 2010
Sold by
Findley Joe N
Bought by
Ast Kenneth R and Ast Frances A
Home Financials for this Owner
Home Financials are based on the most recent Mortgage that was taken out on this home.
Original Mortgage
$185,000
Outstanding Balance
$121,699
Interest Rate
4.52%
Mortgage Type
New Conventional
Estimated Equity
$624,113
Purchase Details
Closed on
Aug 27, 2004
Sold by
Findley Joe N and Findley Carmen
Bought by
Findley Joe N and Findley Carmen
Purchase Details
Closed on
Jul 6, 2004
Sold by
Boeschen Margaret Ruth
Bought by
Findley Joe N and Findley Carmen
Purchase Details
Closed on
Oct 30, 2001
Sold by
Horacek Bobby D and Horacek Shirley E
Bought by
Boeschen Margaret Ruth
Create a Home Valuation Report for This Property
The Home Valuation Report is an in-depth analysis detailing your home's value as well as a comparison with similar homes in the area
Home Values in the Area
Average Home Value in this Area
Purchase History
| Date | Buyer | Sale Price | Title Company |
|---|---|---|---|
| The Kenneth Ray Ast & Frances Avo Ast Jo | -- | None Available | |
| Ast Kenneth R | $360,000 | Fidelity National Title Co | |
| Findley Joe N | -- | -- | |
| Findley Joe N | $531,000 | First American Title Company | |
| Boeschen Margaret Ruth | $315,000 | First American Title |
Source: Public Records
Mortgage History
| Date | Status | Borrower | Loan Amount |
|---|---|---|---|
| Open | Ast Kenneth R | $185,000 |
Source: Public Records
Tax History Compared to Growth
Tax History
| Year | Tax Paid | Tax Assessment Tax Assessment Total Assessment is a certain percentage of the fair market value that is determined by local assessors to be the total taxable value of land and additions on the property. | Land | Improvement |
|---|---|---|---|---|
| 2025 | $5,858 | $461,214 | $256,230 | $204,984 |
| 2024 | $5,811 | $452,171 | $251,206 | $200,965 |
| 2023 | $5,811 | $443,306 | $246,281 | $197,025 |
| 2022 | $5,751 | $434,614 | $241,452 | $193,162 |
| 2021 | $4,587 | $426,093 | $236,718 | $189,375 |
| 2020 | $4,534 | $421,725 | $234,291 | $187,434 |
| 2019 | $4,505 | $413,457 | $229,698 | $183,759 |
| 2018 | $4,451 | $405,351 | $225,195 | $180,156 |
| 2017 | $4,361 | $397,404 | $220,780 | $176,624 |
| 2016 | $4,114 | $389,612 | $216,451 | $173,161 |
| 2015 | $4,054 | $383,760 | $213,200 | $170,560 |
| 2014 | $3,904 | $376,243 | $209,024 | $167,219 |
Source: Public Records
Map
Nearby Homes
- 1337 Black Sage Cir
- 639 Barberry Way
- 808 Albert Way
- 708 Albert Way
- 1790 Calle Laguna
- 1950 Lemon Ranch Rd
- 462 Camino Perillo
- 1060 Dawn Rd
- 1150 Redberry Place
- 961 Jacqueline Place
- 977 Jacqueline Place
- 1225 Dawn Rd
- 2085 Westhampton Dr
- 1024 Maggie Ln
- 1354 Trail View Place
- 1539 Vista Tesoro Place
- 1084 Emma Ln
- 1276 Pomeroy Rd
- 1783 Trilogy Pkwy
- 1441 Vicki Ln
- 568 Masters Cir
- 553 Riviera Cir
- 549 Riviera Cir
- 564 Masters Cir
- 557 Riviera Cir
- 580 Masters Cir
- 545 Riviera Cir
- 561 Riviera Cir
- 565 Riviera Cir
- 584 Masters Cir
- 571 Riviera Cir
- 561 Misty View Way
- 579 Woodgreen Way
- 575 Woodgreen Way
- 583 Woodgreen Way
- 588 Masters Cir
- 556 Riviera Cir
- 587 Woodgreen Way
- 560 Riviera Cir
- 567 Woodgreen Way