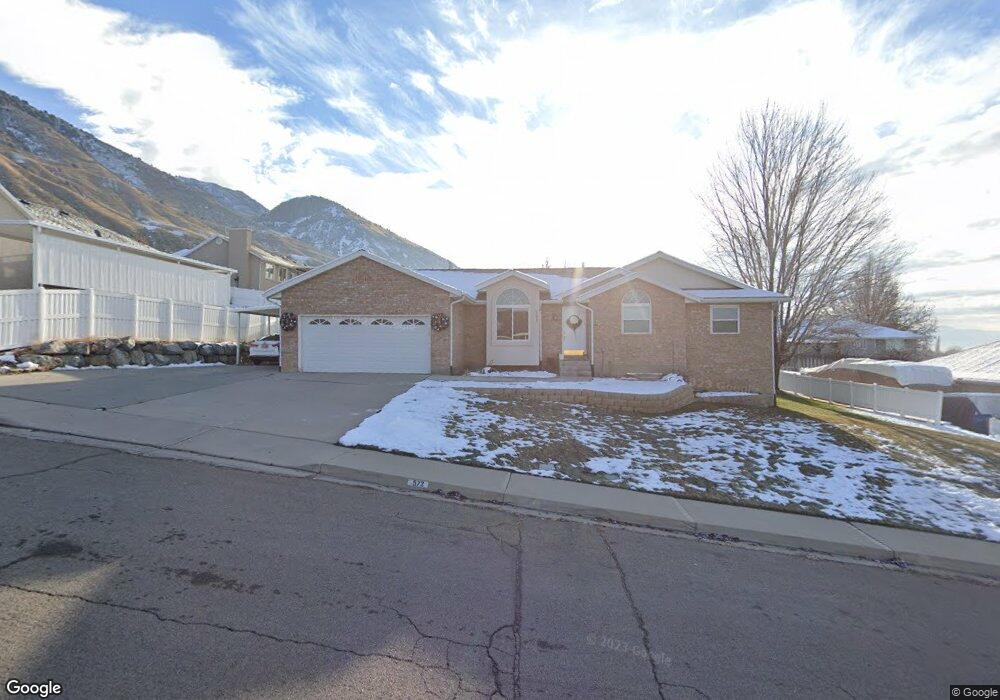
572 N 1180 E Pleasant Grove, UT 84062
Estimated Value: $663,000 - $780,000
6
Beds
3
Baths
3,530
Sq Ft
$199/Sq Ft
Est. Value
About This Home
This home is located at 572 N 1180 E, Pleasant Grove, UT 84062 and is currently estimated at $700,838, approximately $198 per square foot. 572 N 1180 E is a home located in Utah County with nearby schools including Grovecrest Elementary School, Pleasant Grove Junior High School, and Pleasant Grove High School.
Ownership History
Date
Name
Owned For
Owner Type
Purchase Details
Closed on
Feb 27, 2023
Sold by
Watters Neal L and Watters Lisa B
Bought by
Munoz Jonathan and Munoz Ashley Finch
Current Estimated Value
Home Financials for this Owner
Home Financials are based on the most recent Mortgage that was taken out on this home.
Original Mortgage
$591,700
Outstanding Balance
$573,782
Interest Rate
6.33%
Mortgage Type
New Conventional
Estimated Equity
$127,056
Purchase Details
Closed on
Feb 14, 2022
Sold by
Watters Lisa and Watters Neal
Bought by
Watters Neal L and Watters Lisa B
Purchase Details
Closed on
May 20, 2021
Sold by
Watters Lisa
Bought by
Watters Lisa and Watters Neal
Purchase Details
Closed on
Jan 12, 1998
Sold by
Barlow Charlene
Bought by
Barlow Charlene
Home Financials for this Owner
Home Financials are based on the most recent Mortgage that was taken out on this home.
Original Mortgage
$190,800
Interest Rate
7.14%
Create a Home Valuation Report for This Property
The Home Valuation Report is an in-depth analysis detailing your home's value as well as a comparison with similar homes in the area
Home Values in the Area
Average Home Value in this Area
Purchase History
| Date | Buyer | Sale Price | Title Company |
|---|---|---|---|
| Munoz Jonathan | -- | Inwest Title | |
| Watters Neal L | -- | Backman Title Services | |
| Watters Lisa | -- | Wasatch Land & Title | |
| Barlow Charlene | -- | Access Title Company Inc |
Source: Public Records
Mortgage History
| Date | Status | Borrower | Loan Amount |
|---|---|---|---|
| Open | Munoz Jonathan | $591,700 | |
| Previous Owner | Barlow Charlene | $190,800 | |
| Closed | Watters Neal L | $0 |
Source: Public Records
Tax History
| Year | Tax Paid | Tax Assessment Tax Assessment Total Assessment is a certain percentage of the fair market value that is determined by local assessors to be the total taxable value of land and additions on the property. | Land | Improvement |
|---|---|---|---|---|
| 2025 | $2,735 | $350,790 | -- | -- |
| 2024 | $2,735 | $326,535 | $0 | $0 |
| 2023 | $2,704 | $330,385 | $0 | $0 |
| 2022 | $2,621 | $318,615 | $0 | $0 |
| 2021 | $2,265 | $419,300 | $171,600 | $247,700 |
| 2020 | $2,188 | $397,100 | $158,900 | $238,200 |
| 2019 | $2,077 | $389,700 | $151,500 | $238,200 |
| 2018 | $1,938 | $343,800 | $136,700 | $207,100 |
| 2017 | $1,845 | $174,240 | $0 | $0 |
| 2016 | $1,685 | $153,670 | $0 | $0 |
| 2015 | $1,772 | $153,010 | $0 | $0 |
| 2014 | $1,603 | $137,115 | $0 | $0 |
Source: Public Records
Map
Nearby Homes