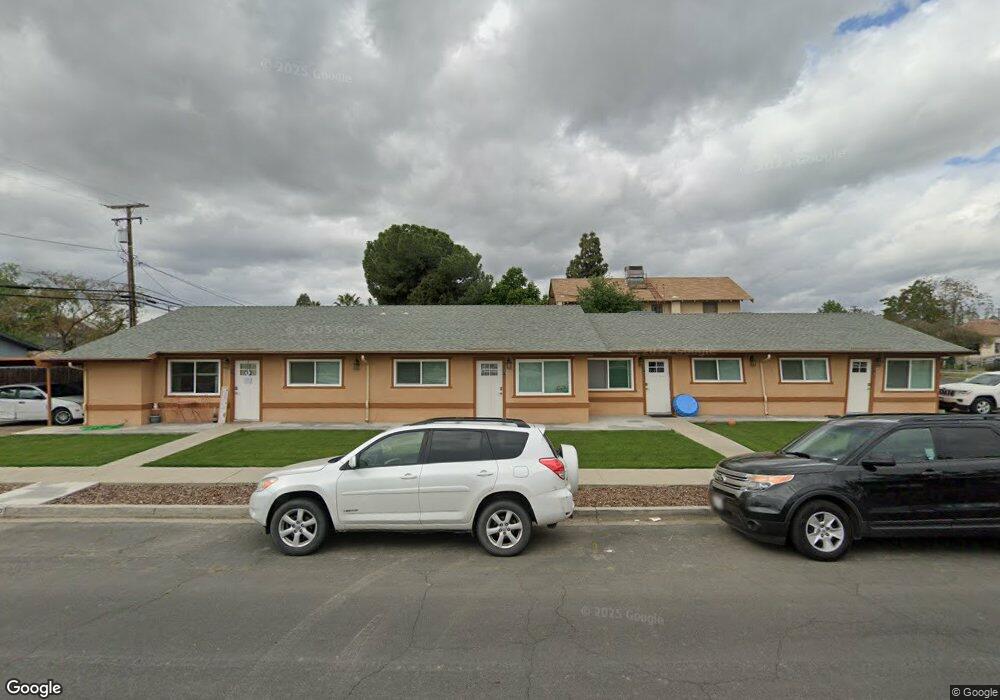
572 N Brown St Hanford, CA 93230
Estimated Value: $519,000 - $686,000
2
Beds
1
Bath
2,956
Sq Ft
$215/Sq Ft
Est. Value
About This Home
This home is located at 572 N Brown St, Hanford, CA 93230 and is currently estimated at $636,530, approximately $215 per square foot. 572 N Brown St is a home located in Kings County with nearby schools including Lee Richmond Elementary School, John F. Kennedy Junior High School, and Hanford High School.
Ownership History
Date
Name
Owned For
Owner Type
Purchase Details
Closed on
Aug 30, 2024
Sold by
Nickell Kevin L and Nickell Ellen C
Bought by
Unzicker Daniel and Luu Natalie
Current Estimated Value
Home Financials for this Owner
Home Financials are based on the most recent Mortgage that was taken out on this home.
Original Mortgage
$462,000
Interest Rate
6.2%
Mortgage Type
New Conventional
Purchase Details
Closed on
Aug 8, 2022
Sold by
Quinlan Bypass Trust
Bought by
Nickell Kevin L and Nickell Ellen C
Home Financials for this Owner
Home Financials are based on the most recent Mortgage that was taken out on this home.
Original Mortgage
$337,500
Interest Rate
5.54%
Purchase Details
Closed on
Jul 14, 2022
Sold by
Quinlan Family Trust
Bought by
Quinlan Bypass Trust
Home Financials for this Owner
Home Financials are based on the most recent Mortgage that was taken out on this home.
Original Mortgage
$337,500
Interest Rate
5.54%
Purchase Details
Closed on
Nov 15, 2021
Sold by
Quinlan Charles Leroy
Bought by
Quinlan Family Trust and Quinlan
Purchase Details
Closed on
Jul 1, 2016
Sold by
Quinlan Charles L and Quinlan Kirsten J
Bought by
Quinlan Charles L and Quinlan Kirsten J
Create a Home Valuation Report for This Property
The Home Valuation Report is an in-depth analysis detailing your home's value as well as a comparison with similar homes in the area
Home Values in the Area
Average Home Value in this Area
Purchase History
| Date | Buyer | Sale Price | Title Company |
|---|---|---|---|
| Unzicker Daniel | $660,000 | Chicago Title Company | |
| Nickell Kevin L | $450,000 | -- | |
| Quinlan Bypass Trust | -- | Boutin Jones Inc | |
| Quinlan Family Trust | -- | -- | |
| Quinlan Charles L | -- | None Available |
Source: Public Records
Mortgage History
| Date | Status | Borrower | Loan Amount |
|---|---|---|---|
| Previous Owner | Unzicker Daniel | $462,000 | |
| Previous Owner | Nickell Kevin L | $337,500 |
Source: Public Records
Tax History Compared to Growth
Tax History
| Year | Tax Paid | Tax Assessment Tax Assessment Total Assessment is a certain percentage of the fair market value that is determined by local assessors to be the total taxable value of land and additions on the property. | Land | Improvement |
|---|---|---|---|---|
| 2025 | $4,980 | $660,300 | $65,000 | $595,300 |
| 2023 | $4,980 | $450,960 | $60,000 | $390,960 |
| 2022 | $1,149 | $104,173 | $9,253 | $94,920 |
| 2021 | $1,137 | $103,320 | $9,072 | $94,248 |
| 2020 | $1,151 | $102,398 | $8,979 | $93,419 |
| 2019 | $1,124 | $99,714 | $8,803 | $90,911 |
| 2018 | $1,089 | $97,547 | $8,630 | $86,197 |
| 2017 | $1,043 | $92,968 | $8,461 | $84,507 |
| 2016 | $1,029 | $91,145 | $8,295 | $82,850 |
| 2015 | $1,023 | $89,776 | $8,170 | $81,606 |
| 2014 | $1,003 | $88,017 | $8,010 | $80,007 |
Source: Public Records
Map
Nearby Homes
- 132 E 10th St
- 228 E Ivy St
- 418 E 10th St
- 427 E 9th St
- 122 E Eighth St
- 315 E Florinda St
- 510 Visalia St
- 822 N Douty St
- Walden Plan at Live Oak - Hidden Oaks II
- Kipling Plan at Live Oak - Hidden Oaks II
- Hawthorne Plan at Live Oak - Hidden Oaks II
- Henley Plan at Live Oak - Hidden Oaks II
- Ashford Plan at Live Oak - Hidden Oaks II
- 415 E Florinda St
- 410 E Florinda St
- 1201 N Harris St
- 311 E 4th St
- 124 E 4th St
- 1236 N Brown St
- 423 W Florinda St