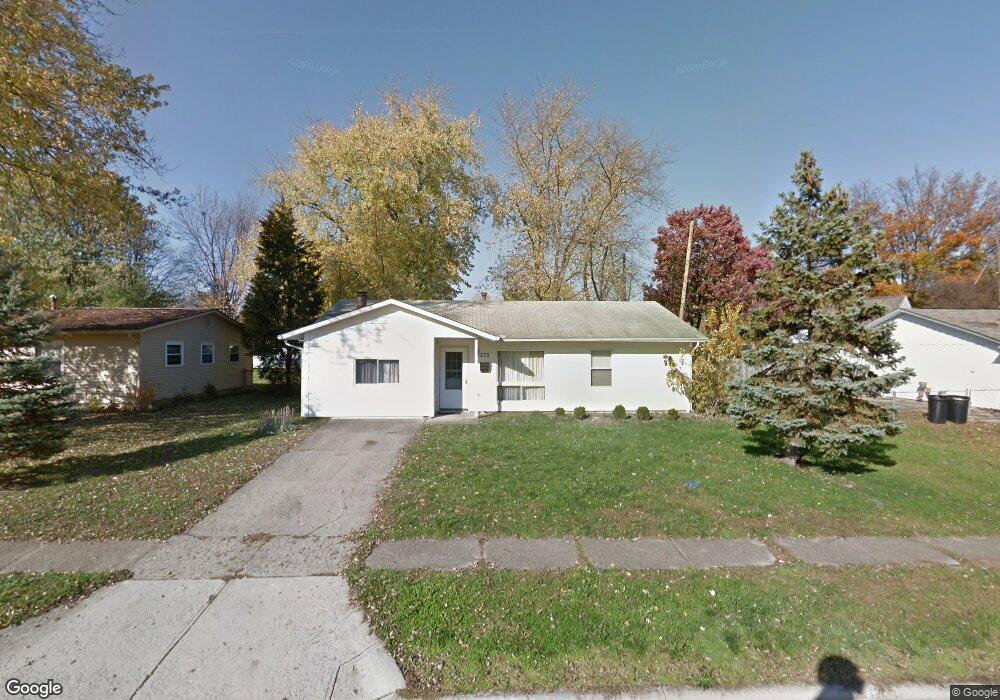
572 Palace Ln Columbus, OH 43230
Estimated Value: $198,000 - $277,000
3
Beds
1
Bath
1,295
Sq Ft
$190/Sq Ft
Est. Value
About This Home
This home is located at 572 Palace Ln, Columbus, OH 43230 and is currently estimated at $246,110, approximately $190 per square foot. 572 Palace Ln is a home located in Franklin County with nearby schools including Royal Manor Elementary School, Gahanna West Middle School, and Lincoln High School.
Ownership History
Date
Name
Owned For
Owner Type
Purchase Details
Closed on
Jan 25, 2007
Sold by
Household Realty Corp
Bought by
Barr Paul B and Barr Teresa A
Current Estimated Value
Home Financials for this Owner
Home Financials are based on the most recent Mortgage that was taken out on this home.
Original Mortgage
$64,000
Outstanding Balance
$39,053
Interest Rate
6.5%
Mortgage Type
Purchase Money Mortgage
Estimated Equity
$207,057
Purchase Details
Closed on
Dec 8, 2006
Sold by
Hammack John F and Case #06Cve03 4237
Bought by
Household Realty Corp
Home Financials for this Owner
Home Financials are based on the most recent Mortgage that was taken out on this home.
Original Mortgage
$64,000
Outstanding Balance
$39,053
Interest Rate
6.5%
Mortgage Type
Purchase Money Mortgage
Estimated Equity
$207,057
Purchase Details
Closed on
Nov 2, 1987
Create a Home Valuation Report for This Property
The Home Valuation Report is an in-depth analysis detailing your home's value as well as a comparison with similar homes in the area
Home Values in the Area
Average Home Value in this Area
Purchase History
| Date | Buyer | Sale Price | Title Company |
|---|---|---|---|
| Barr Paul B | $80,000 | Sovereign | |
| Household Realty Corp | $95,266 | Prefered | |
| -- | $49,900 | -- |
Source: Public Records
Mortgage History
| Date | Status | Borrower | Loan Amount |
|---|---|---|---|
| Open | Barr Paul B | $64,000 |
Source: Public Records
Tax History Compared to Growth
Tax History
| Year | Tax Paid | Tax Assessment Tax Assessment Total Assessment is a certain percentage of the fair market value that is determined by local assessors to be the total taxable value of land and additions on the property. | Land | Improvement |
|---|---|---|---|---|
| 2024 | $3,848 | $64,020 | $22,860 | $41,160 |
| 2023 | $3,800 | $64,020 | $22,860 | $41,160 |
| 2022 | $3,055 | $40,080 | $12,320 | $27,760 |
| 2021 | $2,956 | $40,080 | $12,320 | $27,760 |
| 2020 | $2,933 | $40,080 | $12,320 | $27,760 |
| 2019 | $2,434 | $33,080 | $10,260 | $22,820 |
| 2018 | $2,434 | $33,080 | $10,260 | $22,820 |
| 2017 | $2,344 | $33,080 | $10,260 | $22,820 |
| 2016 | $2,449 | $32,940 | $9,100 | $23,840 |
| 2015 | $2,451 | $32,940 | $9,100 | $23,840 |
| 2014 | $2,432 | $32,940 | $9,100 | $23,840 |
| 2013 | $1,208 | $32,935 | $9,100 | $23,835 |
Source: Public Records
Map
Nearby Homes
- 600 Agler Rd
- 221 Lincolnshire Rd
- 209 Imperial Dr
- 343 Imperial Dr
- 3888 Agler Rd
- 404 Foxwood Dr
- 463 Lincolnshire Rd
- 3784 Armuth Ave
- 470 Deerwood Ave E
- 0 E Minnesota Ave Unit 224018641
- 4093 Adalric Dr
- 2741 Acarie Dr
- 2694 Kantian Dr
- 464 Foxwood Dr
- 668 Kenilworth Ct
- 0 E Emmons Ave
- 0 Stelzer Rd Unit L 225022351
- 4131 Claver Dr
- 2423 Stelzer Rd
- 2851 Acarie Dr
- 578 Palace Ln
- 564 Palace Ln
- 553 Fenchurch Way
- 563 Fenchurch Way
- 571 Fenchurch Way
- 584 Palace Ln
- 579 Fenchurch Way
- 573 Palace Ln
- 565 Palace Ln
- 579 Palace Ln
- 585 Fenchurch Way
- 590 Palace Ln
- 559 Palace Ln
- 585 Palace Ln
- 591 Fenchurch Way
- 553 Palace Ln
- 550 Fenchurch Way
- 596 Palace Ln
- 546 Palace Ln
- 591 Palace Ln