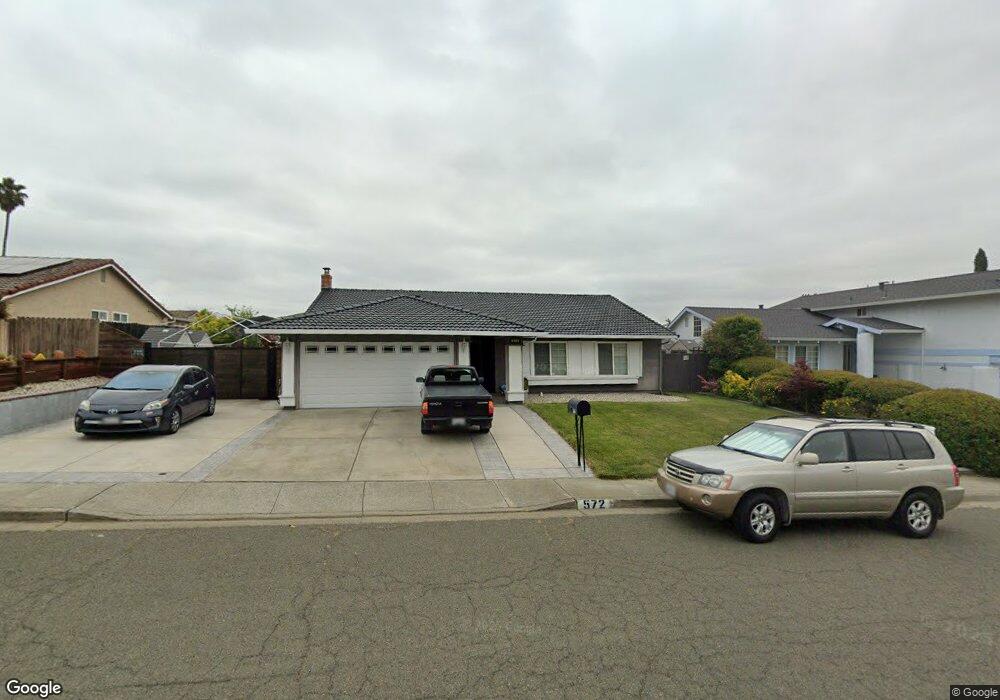
572 Temple Way Vallejo, CA 94591
Estimated Value: $599,224 - $626,000
4
Beds
2
Baths
1,752
Sq Ft
$347/Sq Ft
Est. Value
About This Home
This home is located at 572 Temple Way, Vallejo, CA 94591 and is currently estimated at $608,556, approximately $347 per square foot. 572 Temple Way is a home located in Solano County with nearby schools including Joseph H. Wardlaw Elementary School, Hogan Middle School, and Jesse M. Bethel High School.
Ownership History
Date
Name
Owned For
Owner Type
Purchase Details
Closed on
Jul 21, 2011
Sold by
Federal Home Loan Mortgage Corporation
Bought by
Santo Domingo Terence D and Domingo Bernadette Santo
Current Estimated Value
Home Financials for this Owner
Home Financials are based on the most recent Mortgage that was taken out on this home.
Original Mortgage
$167,600
Outstanding Balance
$115,031
Interest Rate
4.46%
Mortgage Type
New Conventional
Estimated Equity
$493,525
Purchase Details
Closed on
Jul 2, 2010
Sold by
Sendaydiego Arturo M and Sendaydiego Elena B
Bought by
Federal Home Loan Mortgage Corporation
Purchase Details
Closed on
Nov 8, 2002
Sold by
Davis Linda S and Horlacher Myrtle D
Bought by
Sendaydiego Arturo M and Sendaydiego Elena M
Home Financials for this Owner
Home Financials are based on the most recent Mortgage that was taken out on this home.
Original Mortgage
$248,000
Interest Rate
6.62%
Create a Home Valuation Report for This Property
The Home Valuation Report is an in-depth analysis detailing your home's value as well as a comparison with similar homes in the area
Purchase History
| Date | Buyer | Sale Price | Title Company |
|---|---|---|---|
| Santo Domingo Terence D | $209,500 | Lsi Title Company | |
| Federal Home Loan Mortgage Corporation | $180,883 | Accommodation | |
| Sendaydiego Arturo M | $310,000 | Chicago Title Company |
Source: Public Records
Mortgage History
| Date | Status | Borrower | Loan Amount |
|---|---|---|---|
| Open | Santo Domingo Terence D | $167,600 | |
| Previous Owner | Sendaydiego Arturo M | $248,000 |
Source: Public Records
Tax History
| Year | Tax Paid | Tax Assessment Tax Assessment Total Assessment is a certain percentage of the fair market value that is determined by local assessors to be the total taxable value of land and additions on the property. | Land | Improvement |
|---|---|---|---|---|
| 2025 | $4,295 | $263,131 | $50,235 | $212,896 |
| 2024 | $4,295 | $257,972 | $49,250 | $208,722 |
| 2023 | $4,046 | $252,915 | $48,285 | $204,630 |
| 2022 | $3,945 | $247,957 | $47,339 | $200,618 |
| 2021 | $3,858 | $243,096 | $46,411 | $196,685 |
| 2020 | $3,867 | $240,605 | $45,936 | $194,669 |
| 2019 | $3,748 | $235,888 | $45,036 | $190,852 |
| 2018 | $3,516 | $231,263 | $44,153 | $187,110 |
| 2017 | $3,360 | $226,730 | $43,288 | $183,442 |
| 2016 | $2,787 | $222,286 | $42,440 | $179,846 |
| 2015 | $2,750 | $218,948 | $41,803 | $177,145 |
| 2014 | $3,072 | $214,660 | $40,985 | $173,675 |
Source: Public Records
Map
Nearby Homes
- 155 White Pine Dr
- 118 Lytham Way
- 453 Knights Cir
- 401 Avian Dr
- 1290 Rachel Way
- 124 Gregory Ln
- N/A N A
- 223 Wedgewood Ct
- 102 Avian Dr
- 841 Knights Cir
- 41 Canterbury Cir
- 103 Sandalwood Ct
- 136 Evergreen Way
- 2500 Springs Rd Unit 121
- 2500 Springs Rd Unit 116
- 22 Brighton Dr
- 272 Woodridge Dr
- 367 Darley Dr
- 312 Cottonwood Dr
- 730 Britannia Dr
Your Personal Tour Guide
Ask me questions while you tour the home.