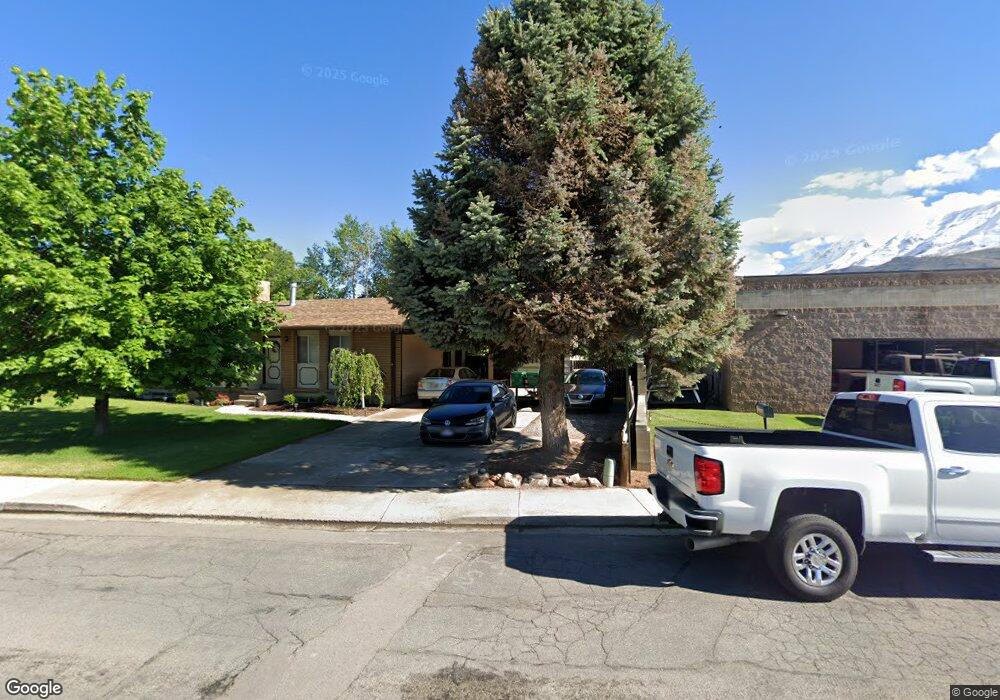
572 W 1700 N Orem, UT 84057
Aspen NeighborhoodEstimated Value: $558,000 - $570,000
5
Beds
2
Baths
1,156
Sq Ft
$488/Sq Ft
Est. Value
About This Home
This home is located at 572 W 1700 N, Orem, UT 84057 and is currently estimated at $564,693, approximately $488 per square foot. 572 W 1700 N is a home located in Utah County with nearby schools including Aspen Elementary School, Oak Canyon Junior High School, and Timpanogos High School.
Ownership History
Date
Name
Owned For
Owner Type
Purchase Details
Closed on
Sep 1, 2016
Sold by
Wilkins Brandon
Bought by
Wilkins Brandon and Wilkins Kathrine
Current Estimated Value
Home Financials for this Owner
Home Financials are based on the most recent Mortgage that was taken out on this home.
Original Mortgage
$224,000
Outstanding Balance
$178,923
Interest Rate
3.43%
Mortgage Type
Commercial
Estimated Equity
$385,770
Purchase Details
Closed on
Jan 28, 2010
Sold by
Sargent Heather Ann and Wilkins Kathrine
Bought by
Squeaks Girls Llc
Purchase Details
Closed on
Oct 30, 2009
Sold by
Sargent Heather Ann
Bought by
Sargent Heather Ann and Wilkins Kathrine
Purchase Details
Closed on
Jun 15, 1996
Sold by
Carlson Ronnie and Carlson Ron
Bought by
Carlson Ronnie
Purchase Details
Closed on
May 14, 1996
Sold by
Radulovich Fay L
Bought by
Carlson Ronnie
Create a Home Valuation Report for This Property
The Home Valuation Report is an in-depth analysis detailing your home's value as well as a comparison with similar homes in the area
Home Values in the Area
Average Home Value in this Area
Purchase History
| Date | Buyer | Sale Price | Title Company |
|---|---|---|---|
| Wilkins Brandon | -- | Cottonwood Title Insurance A | |
| Wilkins Brandon | -- | Cottonwood Title Ins Ag | |
| Squeaks Girls Llc | -- | None Available | |
| Sargent Heather Ann | -- | None Available | |
| Carlson Ronnie | -- | -- | |
| Carlson Ronnie | -- | -- |
Source: Public Records
Mortgage History
| Date | Status | Borrower | Loan Amount |
|---|---|---|---|
| Open | Wilkins Brandon | $224,000 |
Source: Public Records
Tax History
| Year | Tax Paid | Tax Assessment Tax Assessment Total Assessment is a certain percentage of the fair market value that is determined by local assessors to be the total taxable value of land and additions on the property. | Land | Improvement |
|---|---|---|---|---|
| 2025 | $2,471 | $283,360 | -- | -- |
| 2024 | $2,471 | $302,170 | $0 | $0 |
| 2023 | $2,277 | $299,200 | $0 | $0 |
| 2022 | $2,238 | $284,955 | $0 | $0 |
| 2021 | $2,149 | $414,400 | $145,000 | $269,400 |
| 2020 | $1,953 | $370,100 | $129,500 | $240,600 |
| 2019 | $1,747 | $344,300 | $130,300 | $214,000 |
| 2018 | $1,728 | $325,500 | $169,900 | $155,600 |
| 2017 | $1,535 | $154,880 | $0 | $0 |
| 2016 | $1,377 | $128,095 | $0 | $0 |
| 2015 | $1,324 | $116,435 | $0 | $0 |
| 2014 | $1,271 | $111,265 | $0 | $0 |
Source: Public Records
Map
Nearby Homes
- 651 W 1800 N
- 1545 N State St Unit 1
- 686 W 1870 N Unit 12
- 1461 N Amiron Way Unit D
- 1461 N Amiron Way Unit B
- 1547 N 275 West St Unit 5
- 442 W 1950 North St
- 1987 N 400 W
- 531 W 1350 N
- 1405 N 770 W
- 332 W Amiron Way Unit D
- 582 W 1300 N
- 1917 N 860 W
- 967 W 1630 N
- 1535 N 950 W
- 127 S 400 E
- 545 W 1240 N
- 90 S 200 E
- 87 W 1525 N
- 538 W 1120 N
Your Personal Tour Guide
Ask me questions while you tour the home.