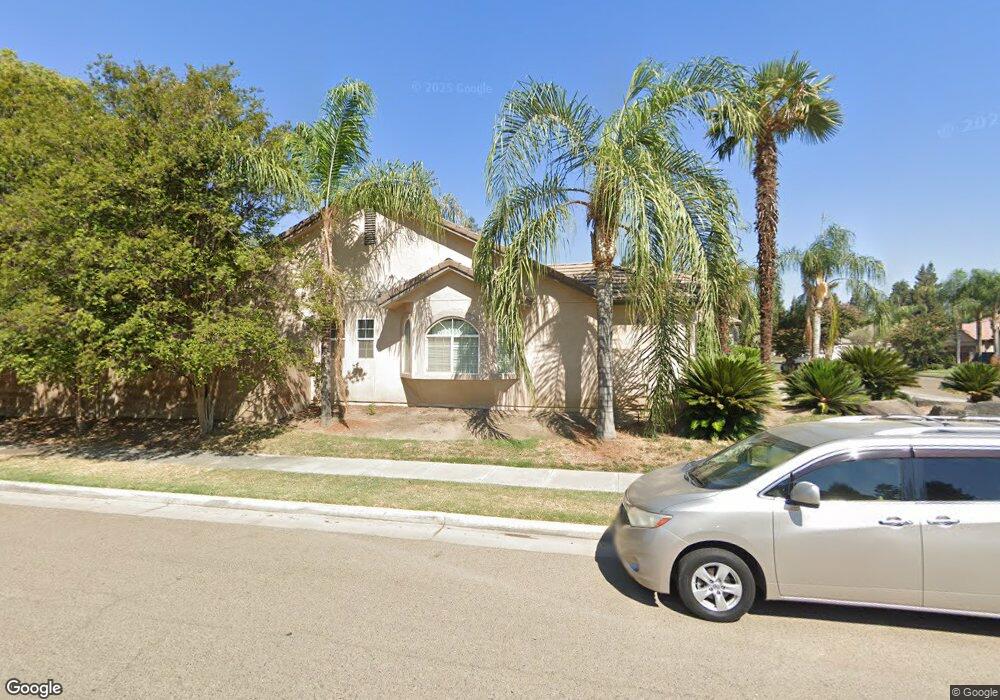
5720 W Vine Ave Visalia, CA 93291
Northwest Visalia NeighborhoodEstimated Value: $636,987 - $763,000
4
Beds
3
Baths
3,009
Sq Ft
$227/Sq Ft
Est. Value
About This Home
This home is located at 5720 W Vine Ave, Visalia, CA 93291 and is currently estimated at $681,997, approximately $226 per square foot. 5720 W Vine Ave is a home located in Tulare County with nearby schools including Hurley Elementary School, Ridgeview Middle, and Redwood High School.
Ownership History
Date
Name
Owned For
Owner Type
Purchase Details
Closed on
Nov 6, 2017
Sold by
Patel Anilkumar
Bought by
Patel Anilkumar
Current Estimated Value
Home Financials for this Owner
Home Financials are based on the most recent Mortgage that was taken out on this home.
Original Mortgage
$310,800
Outstanding Balance
$170,676
Interest Rate
3.83%
Mortgage Type
New Conventional
Estimated Equity
$511,321
Purchase Details
Closed on
Mar 18, 2003
Sold by
College Of The Sequoias Foundation
Bought by
Patel Anil K
Home Financials for this Owner
Home Financials are based on the most recent Mortgage that was taken out on this home.
Original Mortgage
$265,600
Interest Rate
5.37%
Mortgage Type
Purchase Money Mortgage
Purchase Details
Closed on
Aug 13, 2002
Sold by
Centex Homes
Bought by
College Of The Sequoias Foundation
Purchase Details
Closed on
Sep 24, 2001
Sold by
Westland Development Co Llc
Bought by
Centex Homes
Create a Home Valuation Report for This Property
The Home Valuation Report is an in-depth analysis detailing your home's value as well as a comparison with similar homes in the area
Home Values in the Area
Average Home Value in this Area
Purchase History
| Date | Buyer | Sale Price | Title Company |
|---|---|---|---|
| Patel Anilkumar | -- | Chicago Title Company | |
| Patel Anil K | $332,000 | Fidelity National Title Co | |
| College Of The Sequoias Foundation | $49,500 | Commerce Title | |
| Centex Homes | -- | Cuesta Title Company |
Source: Public Records
Mortgage History
| Date | Status | Borrower | Loan Amount |
|---|---|---|---|
| Open | Patel Anilkumar | $310,800 | |
| Previous Owner | Patel Anil K | $265,600 |
Source: Public Records
Tax History Compared to Growth
Tax History
| Year | Tax Paid | Tax Assessment Tax Assessment Total Assessment is a certain percentage of the fair market value that is determined by local assessors to be the total taxable value of land and additions on the property. | Land | Improvement |
|---|---|---|---|---|
| 2025 | $5,252 | $480,863 | $94,144 | $386,719 |
| 2024 | $5,252 | $471,436 | $92,299 | $379,137 |
| 2023 | $5,096 | $462,193 | $90,490 | $371,703 |
| 2022 | $4,860 | $453,131 | $88,716 | $364,415 |
| 2021 | $4,852 | $444,246 | $86,976 | $357,270 |
| 2020 | $4,828 | $439,691 | $86,084 | $353,607 |
| 2019 | $4,678 | $431,070 | $84,396 | $346,674 |
| 2018 | $4,566 | $422,617 | $82,741 | $339,876 |
| 2017 | $4,492 | $414,331 | $81,119 | $333,212 |
| 2016 | $4,426 | $406,206 | $79,528 | $326,678 |
| 2015 | $4,034 | $388,000 | $97,000 | $291,000 |
| 2014 | $4,034 | $367,000 | $92,000 | $275,000 |
Source: Public Records
Map
Nearby Homes
- 5701 W Buena Vista Ave
- 5721 W Prospect Dr
- 5614 W Prospect Dr
- 6310 W Harold Ave
- 5525 W Perez Ave
- 2144 N Tommy St
- 1617 N Aspen Ct
- 5515 W Sunnyview Ave
- 5503 W Sweet Dr
- 1536 N Tamarack St
- 6229 W Ceres Ave
- 6211 W Thompson Ave
- 5235 W Pianosa Ct
- 5837 W Stewart Ave
- 1615 N Volterra Ct
- 3010 N Monarch St
- 3018 N Monarch St
- 1401 W Payson Ave
- 4926 W Buena Vista Ave
- Carrera Plan at Sycamore Ranch
- 2011 N Cottonwood St
- 1462 N Cottonwood St
- 5740 W Vine Ave
- 2023 N Cottonwood St
- 5725 W Vine Ave
- 5748 W Vine Ave
- 2004 N Cottonwood St
- 5711 W Vine Ave
- 5801 W Perez Ave
- 5739 W Vine Ave
- 2000 N Cottonwood St
- 2024 N Cottonwood St
- 5703 W Vine Ave
- 5747 W Vine Ave
- 5809 W Perez Ave
- 5810 W Vine Ave
- 2036 N Quincy St
- 5724 W Buena Vista Ave
- 5809 W Vine Ave
- 5716 W Buena Vista Ave