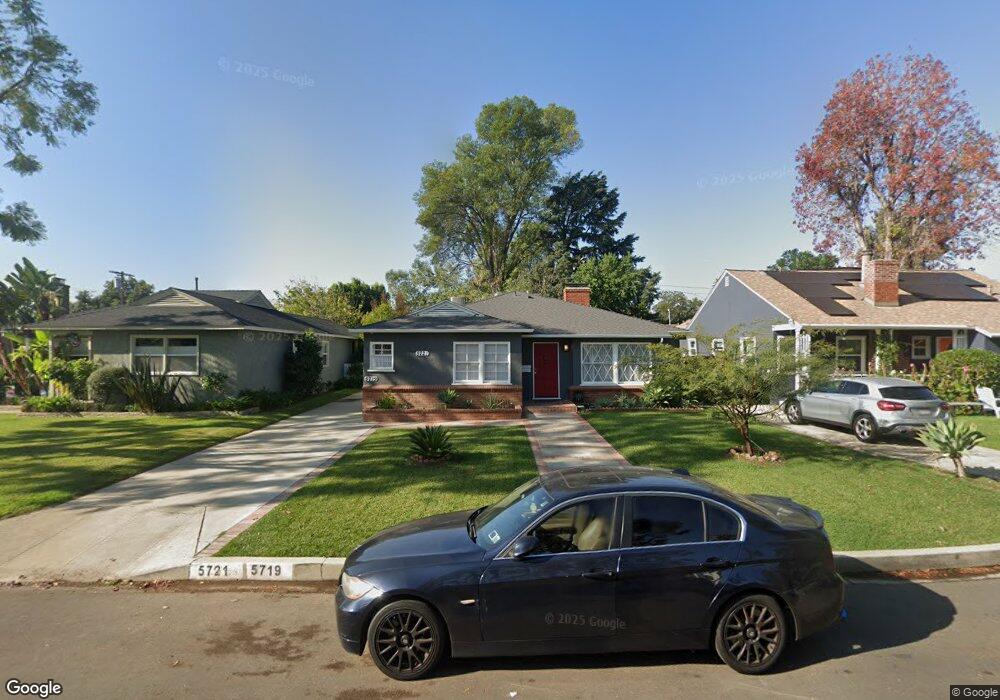
5721 Colbath Ave Unit 1 van Nuys, CA 91401
Estimated Value: $1,139,000 - $1,805,000
3
Beds
2
Baths
2,524
Sq Ft
$550/Sq Ft
Est. Value
About This Home
This home is located at 5721 Colbath Ave Unit 1, van Nuys, CA 91401 and is currently estimated at $1,387,000, approximately $549 per square foot. 5721 Colbath Ave Unit 1 is a home located in Los Angeles County with nearby schools including Chandler Elementary, Van Nuys High School, and Louis D. Armstrong Middle School.
Ownership History
Date
Name
Owned For
Owner Type
Purchase Details
Closed on
Jun 20, 2019
Sold by
Vanek Christopher Stanley
Bought by
Berrio Opatricia Adriana
Current Estimated Value
Purchase Details
Closed on
Jan 6, 2018
Sold by
Vanek George S
Bought by
Vanek Christopher Stanley
Purchase Details
Closed on
Oct 11, 2017
Sold by
Vanek Christopher Stanley
Bought by
Vanek George S
Purchase Details
Closed on
Jun 8, 2017
Sold by
Vanek George S
Bought by
Vanek Christopher Stanley
Purchase Details
Closed on
Sep 3, 2012
Sold by
Vanek George S
Bought by
Vanek Family Revocable Living Trust
Purchase Details
Closed on
Dec 1, 2007
Sold by
Vanek George S
Bought by
Vanek George S
Create a Home Valuation Report for This Property
The Home Valuation Report is an in-depth analysis detailing your home's value as well as a comparison with similar homes in the area
Home Values in the Area
Average Home Value in this Area
Purchase History
We collect this data history from publicly available records. To have your information removed, we recommend requesting removal directly through your county’s website.
| Date | Buyer | Sale Price | Title Company |
|---|---|---|---|
| Berrio Opatricia Adriana | -- | None Available | |
| Vanek Christopher Stanley | -- | None Available | |
| Vanek George S | -- | None Available | |
| Vanek Christopher Stanley | -- | None Available | |
| Vanek Family Revocable Living Trust | -- | None Available | |
| Vanek George S | -- | None Available | |
| Vanek George S | -- | None Available |
Source: Public Records
Tax History
| Year | Tax Paid | Tax Assessment Tax Assessment Total Assessment is a certain percentage of the fair market value that is determined by local assessors to be the total taxable value of land and additions on the property. | Land | Improvement |
|---|---|---|---|---|
| 2025 | $16,213 | $1,336,200 | $935,340 | $400,860 |
| 2024 | $16,102 | $1,310,000 | $917,000 | $393,000 |
| 2023 | $13,462 | $1,097,259 | $643,320 | $453,939 |
| 2022 | $8,705 | $714,401 | $336,115 | $378,286 |
| 2021 | $8,591 | $700,394 | $329,525 | $370,869 |
| 2020 | $5,595 | $436,588 | $325,920 | $110,668 |
| 2019 | $1,266 | $84,556 | $39,531 | $45,025 |
| 2018 | $1,159 | $82,899 | $38,756 | $44,143 |
| 2017 | $1,133 | $81,275 | $37,997 | $43,278 |
| 2016 | $1,093 | $79,682 | $37,252 | $42,430 |
| 2015 | $1,079 | $78,486 | $36,693 | $41,793 |
| 2014 | $1,093 | $76,950 | $35,975 | $40,975 |
Source: Public Records
Map
Nearby Homes
- 13935 Burbank Blvd Unit 105
- 5620 Murietta Ave
- 5710 Cantaloupe Ave
- 5844 Murietta Ave
- 5759 Hazeltine Ave
- 5906 Colbath Ave
- 5744 Stansbury Ave
- 5654 Stansbury Ave
- 5914 Colbath Ave
- 5744 Calhoun Ave
- 13960 Oxnard St
- 13949 Cumpston St
- 5444 Murietta Ave
- 13855 Cumpston St
- 6218 Matilija Ave
- 14157 Tiara St Unit 101
- 5923 Woodman Ave
- 5517 Woodman Ave
- 5539 Buffalo Ave
- 5449 Woodman Ave
- 5727 Colbath Ave
- 5721 Colbath Ave
- 5733 Colbath Ave
- 5717 Colbath Ave
- 5739 Colbath Ave
- 5726 Costello Ave
- 5720 Costello Ave
- 5732 Costello Ave
- 5743 Colbath Ave
- 5716 Costello Ave
- 5736 Costello Ave
- 5726 Colbath Ave
- 5707 Colbath Ave
- 5720 Colbath Ave
- 5742 Costello Ave
- 5712 Costello Ave
- 5749 Colbath Ave
- 5731 Ranchito Ave
- 5716 Colbath Ave
- 5706 Costello Ave
Your Personal Tour Guide
Ask me questions while you tour the home.