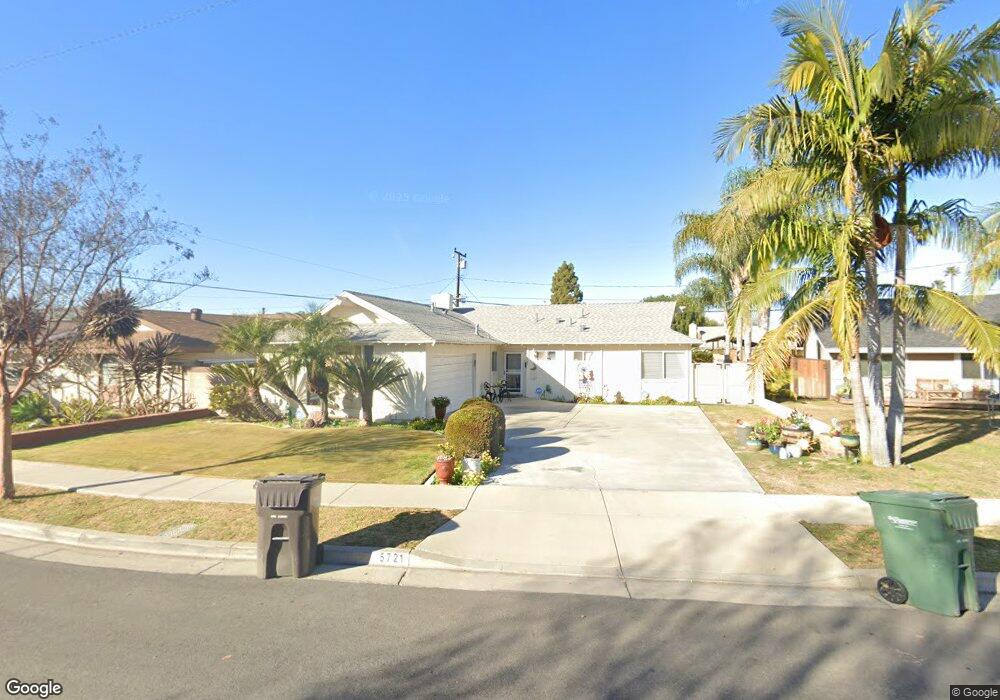
5721 Littler Dr Huntington Beach, CA 92649
Estimated Value: $1,124,681 - $1,226,000
3
Beds
2
Baths
1,309
Sq Ft
$911/Sq Ft
Est. Value
About This Home
This home is located at 5721 Littler Dr, Huntington Beach, CA 92649 and is currently estimated at $1,192,670, approximately $911 per square foot. 5721 Littler Dr is a home located in Orange County with nearby schools including Village View Elementary School, Spring View Middle School, and Marina High School.
Ownership History
Date
Name
Owned For
Owner Type
Purchase Details
Closed on
Dec 8, 1999
Sold by
Ahmadi Mohamad Lotfi and Kassen Dipam
Bought by
Paugh Kathy
Current Estimated Value
Home Financials for this Owner
Home Financials are based on the most recent Mortgage that was taken out on this home.
Original Mortgage
$236,000
Outstanding Balance
$82,170
Interest Rate
9.35%
Estimated Equity
$1,110,500
Purchase Details
Closed on
Jul 28, 1999
Sold by
Michael Schermerhorn and Michael Lyn
Bought by
Ahmadi Mohamad Lotfi and Kassen Dipam
Home Financials for this Owner
Home Financials are based on the most recent Mortgage that was taken out on this home.
Original Mortgage
$176,000
Interest Rate
7.66%
Purchase Details
Closed on
Aug 12, 1998
Sold by
Burkhardt Philip J and Burkhardt Tracy C
Bought by
Lanning Penny Diane
Home Financials for this Owner
Home Financials are based on the most recent Mortgage that was taken out on this home.
Original Mortgage
$150,000
Interest Rate
7%
Create a Home Valuation Report for This Property
The Home Valuation Report is an in-depth analysis detailing your home's value as well as a comparison with similar homes in the area
Home Values in the Area
Average Home Value in this Area
Purchase History
| Date | Buyer | Sale Price | Title Company |
|---|---|---|---|
| Paugh Kathy | $295,000 | Fidelity National Title Ins | |
| Ahmadi Mohamad Lotfi | $220,000 | -- | |
| Lanning Penny Diane | $239,000 | Landwood Title Company |
Source: Public Records
Mortgage History
| Date | Status | Borrower | Loan Amount |
|---|---|---|---|
| Open | Paugh Kathy | $236,000 | |
| Previous Owner | Ahmadi Mohamad Lotfi | $176,000 | |
| Previous Owner | Lanning Penny Diane | $150,000 | |
| Closed | Paugh Kathy | $44,250 |
Source: Public Records
Tax History Compared to Growth
Tax History
| Year | Tax Paid | Tax Assessment Tax Assessment Total Assessment is a certain percentage of the fair market value that is determined by local assessors to be the total taxable value of land and additions on the property. | Land | Improvement |
|---|---|---|---|---|
| 2025 | $4,413 | $374,515 | $294,994 | $79,521 |
| 2024 | $4,413 | $367,172 | $289,210 | $77,962 |
| 2023 | $4,311 | $359,973 | $283,539 | $76,434 |
| 2022 | $4,246 | $352,915 | $277,979 | $74,936 |
| 2021 | $4,170 | $345,996 | $272,529 | $73,467 |
| 2020 | $4,123 | $342,449 | $269,735 | $72,714 |
| 2019 | $4,054 | $335,735 | $264,446 | $71,289 |
| 2018 | $3,965 | $329,152 | $259,260 | $69,892 |
| 2017 | $3,903 | $322,699 | $254,177 | $68,522 |
| 2016 | $3,747 | $316,372 | $249,193 | $67,179 |
| 2015 | $3,690 | $311,620 | $245,450 | $66,170 |
| 2014 | $3,618 | $305,516 | $240,642 | $64,874 |
Source: Public Records
Map
Nearby Homes
- 5751 Mangrum Dr
- 16261 Angler Ln
- 5591 Heil Ave
- 16542 Los Verdes Ln
- 5192 Skylark Dr
- 5131 Skylark Dr
- 5200 Heil Ave Unit 18
- 5200 Heil Ave Unit 8
- 16652 Busby Ln
- 6292 Heil Ave
- 15801 Carrie Ln
- 5082 Bluejay Cir
- 16444 Bolsa Chica St Unit 16
- 16444 Bolsa Chica St Unit 26
- 16444 Bolsa Chica St Unit 167
- 16444 Bolsa Chica St Unit 60
- 16444 Bolsa Chica St Unit 74
- 16444 Bolsa Chica St Unit 21
- 16444 Bolsa Chica St Unit 137
- 6351 Gloria Dr
- 5711 Littler Dr
- 5731 Littler Dr
- 5722 Mangrum Dr
- 5732 Mangrum Dr
- 5712 Mangrum Dr
- 5701 Littler Dr
- 16132 Littler Dr
- 5742 Mangrum Dr
- 5702 Mangrum Dr
- 5722 Littler Dr
- 5712 Littler Dr
- 5691 Littler Dr
- 5752 Mangrum Dr
- 16142 Littler Dr
- 5702 Littler Dr
- 5692 Mangrum Dr
- 16171 Littler Dr
- 5681 Littler Dr
- 5692 Littler Dr
- 16131 Nassau Ln