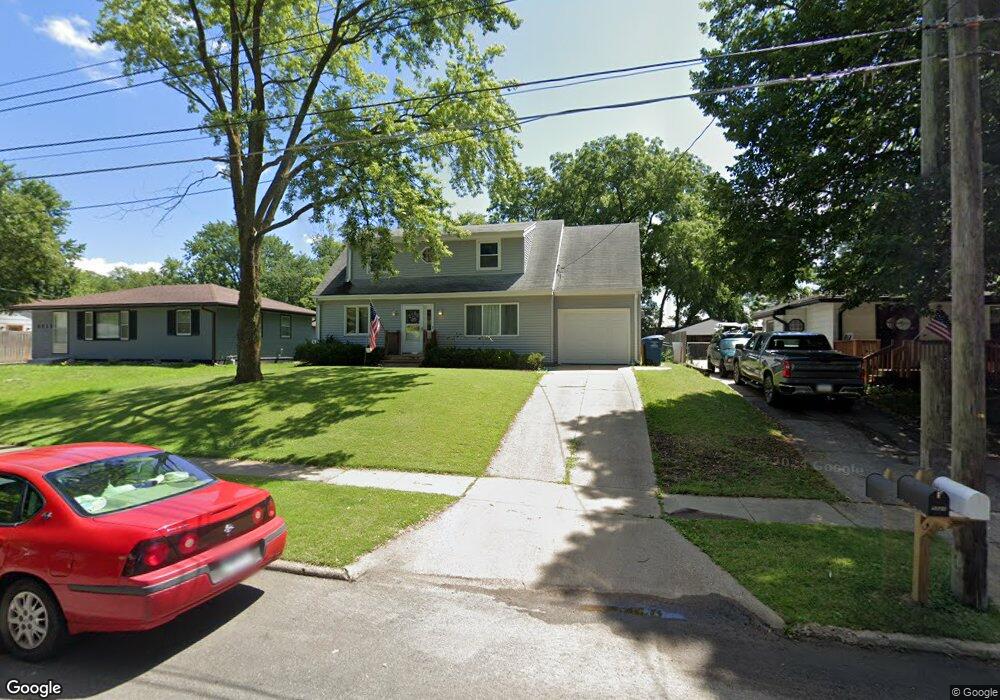
5721 SE 8th St Des Moines, IA 50315
South Central DSM NeighborhoodEstimated Value: $206,000 - $264,000
4
Beds
2
Baths
1,363
Sq Ft
$171/Sq Ft
Est. Value
About This Home
This home is located at 5721 SE 8th St, Des Moines, IA 50315 and is currently estimated at $233,124, approximately $171 per square foot. 5721 SE 8th St is a home located in Polk County with nearby schools including Lovejoy Elementary School, Mccombs Middle School, and Lincoln High School.
Ownership History
Date
Name
Owned For
Owner Type
Purchase Details
Closed on
Jul 24, 2008
Sold by
Rms Residential Properties Llc
Bought by
Nk Properties & Investments Llc
Current Estimated Value
Home Financials for this Owner
Home Financials are based on the most recent Mortgage that was taken out on this home.
Original Mortgage
$100,000
Interest Rate
6.51%
Mortgage Type
Purchase Money Mortgage
Purchase Details
Closed on
Apr 3, 2008
Sold by
Beam Janet Marie
Bought by
Rms Residential Properties Llc
Purchase Details
Closed on
Dec 21, 2000
Sold by
Shaffer Chris R
Bought by
Beam Kenton J and Beam Janet M
Home Financials for this Owner
Home Financials are based on the most recent Mortgage that was taken out on this home.
Original Mortgage
$89,910
Interest Rate
7.8%
Mortgage Type
Balloon
Purchase Details
Closed on
Jul 26, 1998
Sold by
Johnson James R and Johnson Rhonda
Bought by
Shaffer Chris R
Home Financials for this Owner
Home Financials are based on the most recent Mortgage that was taken out on this home.
Original Mortgage
$85,500
Interest Rate
7.13%
Create a Home Valuation Report for This Property
The Home Valuation Report is an in-depth analysis detailing your home's value as well as a comparison with similar homes in the area
Home Values in the Area
Average Home Value in this Area
Purchase History
| Date | Buyer | Sale Price | Title Company |
|---|---|---|---|
| Nk Properties & Investments Llc | $89,500 | None Available | |
| Rms Residential Properties Llc | $97,041 | None Available | |
| Beam Kenton J | $99,500 | -- | |
| Shaffer Chris R | $89,500 | -- |
Source: Public Records
Mortgage History
| Date | Status | Borrower | Loan Amount |
|---|---|---|---|
| Closed | Nk Properties & Investments Llc | $100,000 | |
| Previous Owner | Beam Kenton J | $89,910 | |
| Previous Owner | Shaffer Chris R | $85,500 |
Source: Public Records
Tax History Compared to Growth
Tax History
| Year | Tax Paid | Tax Assessment Tax Assessment Total Assessment is a certain percentage of the fair market value that is determined by local assessors to be the total taxable value of land and additions on the property. | Land | Improvement |
|---|---|---|---|---|
| 2025 | $3,598 | $210,400 | $34,600 | $175,800 |
| 2024 | $3,598 | $182,870 | $31,400 | $151,470 |
| 2023 | $3,452 | $193,800 | $31,400 | $162,400 |
| 2022 | $3,426 | $157,400 | $26,200 | $131,200 |
| 2021 | $3,410 | $157,400 | $26,200 | $131,200 |
| 2020 | $3,580 | $147,600 | $24,400 | $123,200 |
| 2019 | $3,258 | $138,100 | $24,400 | $113,700 |
| 2018 | $3,224 | $121,200 | $21,000 | $100,200 |
| 2017 | $2,840 | $121,200 | $21,000 | $100,200 |
| 2016 | $2,766 | $105,000 | $19,400 | $85,600 |
| 2015 | $2,766 | $105,000 | $19,400 | $85,600 |
| 2014 | $2,902 | $109,200 | $19,800 | $89,400 |
Source: Public Records
Map
Nearby Homes
- 817 E Diehl Ave
- 613 Cummins Rd
- 439 E Porter Ave
- 433 E Payton Ave
- 401 E Wall Ave
- 5205 SE 9th St
- 5600 SE 4th St
- 801 E Hackley Ave
- 313 E Payton Ave
- 904 E Hackley Ave
- 712 E Hackley Ave
- 7500 SE Bloomfield Rd Unit 40
- 217 E Payton Ave
- 401 E Mckinley Ave
- 1660 E Army Post Rd
- 5501 S Union St
- 5936 SW 2nd St
- 6901 SE 14th St Unit 30
- 311 E Emma Ave
- 448 Scandia Ave
- 5717 SE 8th St
- 5801 SE 8th St
- 5713 SE 8th St
- 5807 SE 8th St
- 5811 SE 8th St
- 5720 SE 8th St
- 5800 SE 8th St
- 5716 SE 8th St
- 5806 SE 8th St
- 5817 SE 8th St
- 811 E Diehl Ave
- 5810 SE 8th St
- 5703 SE 8th St
- 731 E Diehl Ave
- 5901 SE 8th St
- 5816 SE 8th St
- 903 E Diehl Ave
- 5721 SE 7th Ct
- 729 E Diehl Ave
- 5801 SE 7th Ct