Estimated Value: $111,000 - $149,000
2
Beds
1
Bath
874
Sq Ft
$152/Sq Ft
Est. Value
About This Home
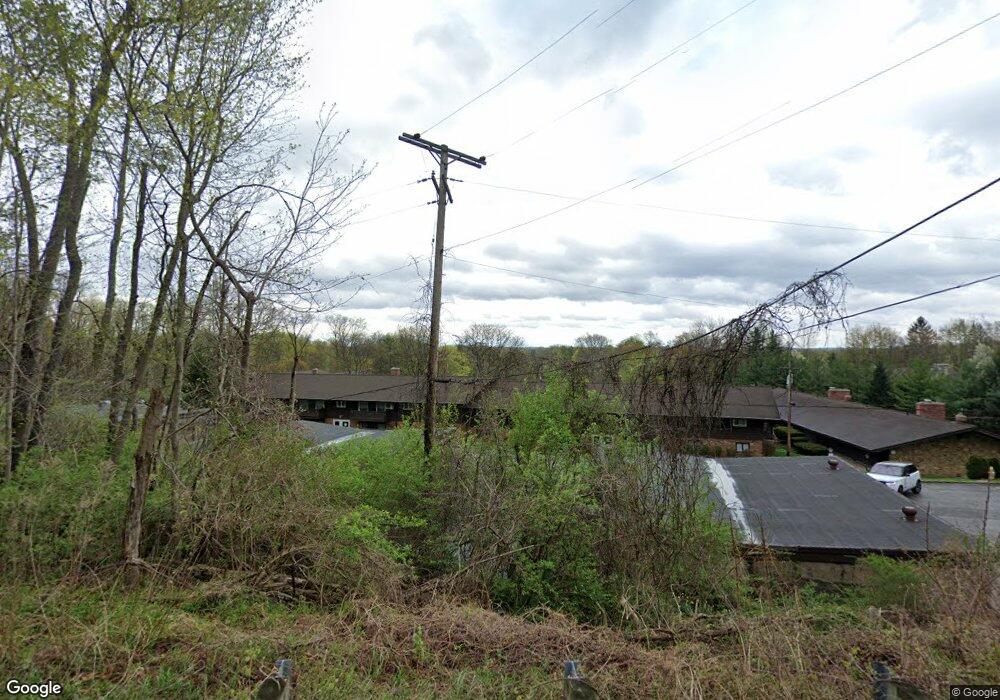
This home is located at 5721 Som Center Rd, Solon, OH 44139 and is currently estimated at $132,447, approximately $151 per square foot. 5721 Som Center Rd is a home located in Cuyahoga County with nearby schools including Orchard Middle School, Parkside Elementary School, and Solon Middle School.
Ownership History
Date
Name
Owned For
Owner Type
Purchase Details
Closed on
Nov 8, 2020
Sold by
David P True Declarationof Trust and True David P
Bought by
Davis Jacinta
Current Estimated Value
Home Financials for this Owner
Home Financials are based on the most recent Mortgage that was taken out on this home.
Original Mortgage
$59,200
Outstanding Balance
$52,661
Interest Rate
2.78%
Estimated Equity
$79,786
Purchase Details
Closed on
Apr 11, 2005
Sold by
True David P
Bought by
True David P
Purchase Details
Closed on
Oct 9, 1984
Sold by
Damico Michael C
Bought by
True David P
Purchase Details
Closed on
Jul 20, 1982
Sold by
Hewett Marilyn Mae
Bought by
Damico Michael C
Purchase Details
Closed on
Jul 24, 1978
Sold by
Kelkar Manohar S
Bought by
Hewett Marilyn Mae
Purchase Details
Closed on
Jan 1, 1975
Bought by
Kelkar Manohar S
Create a Home Valuation Report for This Property
The Home Valuation Report is an in-depth analysis detailing your home's value as well as a comparison with similar homes in the area
Home Values in the Area
Average Home Value in this Area
Purchase History
| Date | Buyer | Sale Price | Title Company |
|---|---|---|---|
| Davis Jacinta | $7,400,000 | -- | |
| True David P | -- | Revere Title | |
| True David P | $52,000 | -- | |
| Damico Michael C | $52,000 | -- | |
| Hewett Marilyn Mae | $51,900 | -- | |
| Kelkar Manohar S | -- | -- |
Source: Public Records
Mortgage History
| Date | Status | Borrower | Loan Amount |
|---|---|---|---|
| Open | Davis Jacinta | $59,200 | |
| Closed | Davis Jacinta | -- |
Source: Public Records
Tax History Compared to Growth
Tax History
| Year | Tax Paid | Tax Assessment Tax Assessment Total Assessment is a certain percentage of the fair market value that is determined by local assessors to be the total taxable value of land and additions on the property. | Land | Improvement |
|---|---|---|---|---|
| 2024 | $2,092 | $38,220 | $3,815 | $34,405 |
| 2023 | $1,734 | $25,910 | $2,140 | $23,770 |
| 2022 | $1,730 | $25,900 | $2,140 | $23,770 |
| 2021 | $1,710 | $25,900 | $2,140 | $23,770 |
| 2020 | $1,334 | $18,480 | $1,860 | $16,630 |
| 2019 | $1,292 | $52,800 | $5,300 | $47,500 |
| 2018 | $1,157 | $18,480 | $1,860 | $16,630 |
| 2017 | $1,544 | $23,320 | $2,350 | $20,970 |
| 2016 | $1,529 | $23,320 | $2,350 | $20,970 |
| 2015 | $1,585 | $23,320 | $2,350 | $20,970 |
| 2014 | $1,585 | $23,320 | $2,350 | $20,970 |
Source: Public Records
Map
Nearby Homes
- 5721 Som Center Rd Unit 25
- 5575 Hummingbird Cir
- 32775 Ledge Hill Dr
- 5929 Som Center Rd
- 32650 Stony Brook Ln
- 34600 Mcafee Dr
- 112 Meadow Ln
- 35906 Solon Rd
- 5241 Som Center Rd
- 36265 Timberlane Dr
- 5151 Som Center Rd
- 32560 Wintergreen Dr
- 5158 Lansdowne Dr
- V/L (1.32 Acres) Aurora Rd
- 5130 Cheswick Dr
- 5009 Lansdowne Dr
- 6454 Huntington Dr
- 36767 Meadowdale Dr
- 38280 Fox Run Dr
- 5225 Harper Rd
- 5721 Som Center Rd Unit 20
- 5721 Som Center Rd Unit 23
- 5721 Som Center Rd Unit 15
- 5721 Som Center Rd Unit 22
- 5721 Som Center Rd
- 5721 Som Center Rd
- 5721 Som Center Rd
- 5721 Som Center Rd
- 5721 Som Center Rd
- 5721 Som Center Rd
- 5721 Som Center Rd
- 5721 Som Center Rd
- 5721 Som Center Rd Unit 12
- 5721 Som Center Rd Unit 19
- 5721 Som Center Rd Unit 21
- 5721 Som Center Rd Unit 24
- 5721 Som Center Rd Unit 13
- 5721 Som Center Rd Unit 26
- 5721 Som Center Rd Unit 11
- 5721 Som Center Rd Unit 16