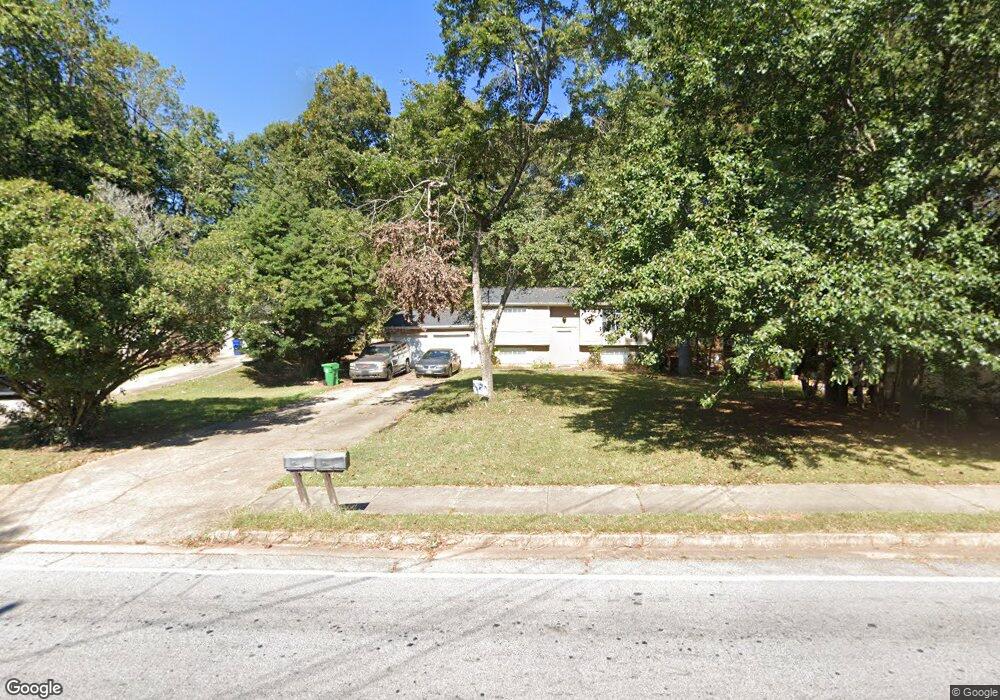
5722 Marbut Rd Lithonia, GA 30058
Estimated Value: $237,713 - $268,000
4
Beds
2
Baths
1,830
Sq Ft
$136/Sq Ft
Est. Value
About This Home
This home is located at 5722 Marbut Rd, Lithonia, GA 30058 and is currently estimated at $248,928, approximately $136 per square foot. 5722 Marbut Rd is a home located in DeKalb County with nearby schools including Panola Way Elementary School, Redan Middle School, and Redan High School.
Ownership History
Date
Name
Owned For
Owner Type
Purchase Details
Closed on
Mar 16, 2021
Sold by
Sph Property Three Llc
Bought by
Atlanta Neighborhood Development Partner
Current Estimated Value
Purchase Details
Closed on
Feb 2, 2021
Sold by
Thomas Mark A
Bought by
Sph Property Three Llc
Purchase Details
Closed on
Aug 26, 2002
Sold by
Citifinancial Mtg Co Inc
Bought by
Thomas Mark A
Home Financials for this Owner
Home Financials are based on the most recent Mortgage that was taken out on this home.
Original Mortgage
$96,800
Interest Rate
6.01%
Mortgage Type
New Conventional
Purchase Details
Closed on
Feb 5, 2002
Sold by
Hepburn Norma
Bought by
Citifinancial Mortgage Co
Purchase Details
Closed on
Feb 27, 1997
Sold by
West Coastinvest Grp
Bought by
Hepburn Norma
Create a Home Valuation Report for This Property
The Home Valuation Report is an in-depth analysis detailing your home's value as well as a comparison with similar homes in the area
Home Values in the Area
Average Home Value in this Area
Purchase History
| Date | Buyer | Sale Price | Title Company |
|---|---|---|---|
| Atlanta Neighborhood Development Partner | $179,000 | -- | |
| Sph Property Three Llc | $171,400 | -- | |
| Thomas Mark A | $121,000 | -- | |
| Citifinancial Mortgage Co | $76,500 | -- | |
| Hepburn Norma | $93,000 | -- | |
| West Coastinvest | $76,000 | -- |
Source: Public Records
Mortgage History
| Date | Status | Borrower | Loan Amount |
|---|---|---|---|
| Previous Owner | Thomas Mark A | $96,800 | |
| Closed | West Coastinvest | $0 |
Source: Public Records
Tax History Compared to Growth
Tax History
| Year | Tax Paid | Tax Assessment Tax Assessment Total Assessment is a certain percentage of the fair market value that is determined by local assessors to be the total taxable value of land and additions on the property. | Land | Improvement |
|---|---|---|---|---|
| 2025 | $4,766 | $99,360 | $15,200 | $84,160 |
| 2024 | $4,858 | $101,520 | $15,200 | $86,320 |
| 2023 | $4,858 | $102,040 | $15,200 | $86,840 |
| 2022 | $3,456 | $71,600 | $6,520 | $65,080 |
| 2021 | $2,815 | $57,000 | $3,920 | $53,080 |
| 2020 | $2,134 | $41,480 | $3,920 | $37,560 |
| 2019 | $2,155 | $41,960 | $3,920 | $38,040 |
| 2018 | $1,612 | $34,920 | $3,920 | $31,000 |
| 2017 | $1,715 | $31,800 | $3,920 | $27,880 |
| 2016 | $1,592 | $28,160 | $3,120 | $25,040 |
| 2014 | $1,533 | $23,960 | $3,120 | $20,840 |
Source: Public Records
Map
Nearby Homes
- 5676 Marbut Rd
- 5734 Wellborn Oaks Ct
- 1931 Patton Place
- 5786 Singer Ct
- 1984 Singer Way
- 5813 Wellborn Oaks Ct
- 1897 Madras Ct
- 1882 Corduroy Ct
- 5595 Marbut Rd
- 5570 Downs Way
- 5578 Marbut Rd
- 2026 Mallard Crest
- 5537 Wellborn Creek Dr
- 5805 Marbut Rd
- 5541 Panola Place
- 1946 Taffeta Trail
- 2373 Wellborn Hills Ct
- 2089 Quilt Ct
- 5774 Taffeta Ct
- 2357 Wellborn Hills Place
- 5728 Marbut Rd
- 5718 Marbut Rd
- 5718 Saint Thomas Dr
- 5734 Marbut Rd
- 5712 St Thomas
- 5722 Saint Thomas Dr
- 5712 Saint Thomas Dr
- 5708 St Thomas Dr
- 5728 Saint Thomas Dr Unit 6
- 5708 Saint Thomas Dr
- 5676 Wellborn Oaks Ct
- 5668 Wellborn Oaks Ct
- 5682 Wellborn Oaks Ct Unit 1
- 5662 Wellborn Oaks Ct
- 5668 Wellborn Oaks Ct
- 5688 Wellborn Oaks Ct
- 5702 Saint Thomas Dr
- 5702 St Thomas Dr
- 5732 Saint Thomas Dr
- 5656 Wellborn Oaks Ct