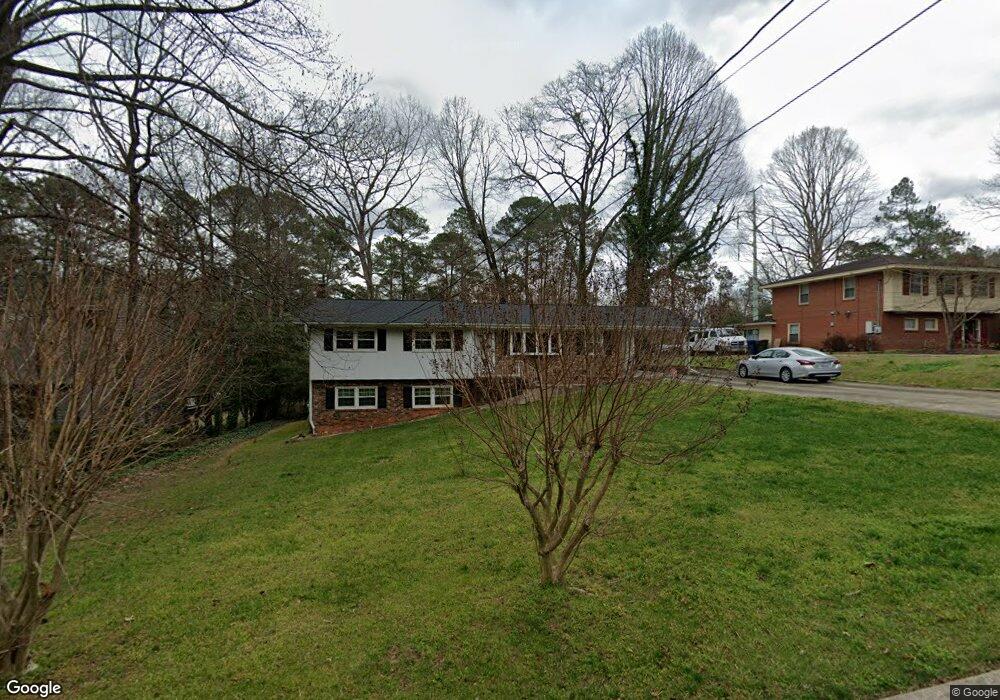
5724 Deblyn Ave Raleigh, NC 27612
Northwest Raleigh NeighborhoodEstimated Value: $452,000 - $547,688
4
Beds
3
Baths
2,332
Sq Ft
$215/Sq Ft
Est. Value
About This Home
This home is located at 5724 Deblyn Ave, Raleigh, NC 27612 and is currently estimated at $501,672, approximately $215 per square foot. 5724 Deblyn Ave is a home located in Wake County with nearby schools including York Elementary School, Oberlin Middle School, and Sanderson High School.
Ownership History
Date
Name
Owned For
Owner Type
Purchase Details
Closed on
Jul 6, 2017
Sold by
Diaz Bienvenido A and Diaz Ana
Bought by
Diaz Bienvenido A and Diaz Ana
Current Estimated Value
Home Financials for this Owner
Home Financials are based on the most recent Mortgage that was taken out on this home.
Original Mortgage
$224,000
Outstanding Balance
$184,708
Interest Rate
3.62%
Mortgage Type
Adjustable Rate Mortgage/ARM
Estimated Equity
$316,964
Purchase Details
Closed on
Oct 19, 2013
Sold by
Busgith Janis and Busgith Boodnarine
Bought by
Diaz Bienvenido A
Purchase Details
Closed on
Jun 13, 2008
Sold by
Chin Dorothy
Bought by
Diaz Bienvenido A and Rodriguez Diaz Janis
Home Financials for this Owner
Home Financials are based on the most recent Mortgage that was taken out on this home.
Original Mortgage
$210,000
Interest Rate
4.75%
Mortgage Type
Purchase Money Mortgage
Create a Home Valuation Report for This Property
The Home Valuation Report is an in-depth analysis detailing your home's value as well as a comparison with similar homes in the area
Home Values in the Area
Average Home Value in this Area
Purchase History
| Date | Buyer | Sale Price | Title Company |
|---|---|---|---|
| Diaz Bienvenido A | -- | None Available | |
| Diaz Bienvenido A | -- | None Available | |
| Diaz Bienvenido A | $210,000 | None Available |
Source: Public Records
Mortgage History
| Date | Status | Borrower | Loan Amount |
|---|---|---|---|
| Open | Diaz Bienvenido A | $224,000 | |
| Previous Owner | Diaz Bienvenido A | $210,000 |
Source: Public Records
Tax History Compared to Growth
Tax History
| Year | Tax Paid | Tax Assessment Tax Assessment Total Assessment is a certain percentage of the fair market value that is determined by local assessors to be the total taxable value of land and additions on the property. | Land | Improvement |
|---|---|---|---|---|
| 2025 | $3,930 | $448,396 | $225,000 | $223,396 |
| 2024 | $3,914 | $448,396 | $225,000 | $223,396 |
| 2023 | $3,173 | $289,233 | $115,000 | $174,233 |
| 2022 | $2,948 | $289,233 | $115,000 | $174,233 |
| 2021 | $2,834 | $289,233 | $115,000 | $174,233 |
| 2020 | $2,783 | $289,233 | $115,000 | $174,233 |
| 2019 | $2,702 | $231,459 | $100,000 | $131,459 |
| 2018 | $2,549 | $231,459 | $100,000 | $131,459 |
| 2017 | $2,428 | $231,459 | $100,000 | $131,459 |
| 2016 | $2,378 | $231,459 | $100,000 | $131,459 |
| 2015 | $2,239 | $214,276 | $92,650 | $121,626 |
| 2014 | -- | $214,276 | $92,650 | $121,626 |
Source: Public Records
Map
Nearby Homes
- 5904 Deblyn Ave
- 3830 Summerwood Ct
- 3611 Plumbridge Ct
- 6140 Loch Laural Ln
- 5105 Shamrock Dr
- 5205 Rembert Dr
- 5816 Winthrop Dr
- 6117 Dodsworth Dr
- 5918 Winthrop Dr
- 3009 Walton Heath Ct
- 6422 Tanner Oak Ln
- 6424 Tanner Oak Ln
- 204 Autumn Chase Dr Unit 204
- 6115 Winthrop Dr
- 5538 Sharpe Dr
- 4813 Glen Forest Dr
- 4808 Glen Forest Dr
- 4329 Pine Springs Ct
- 4408 Queenstown Ct
- 202 Oak Hollow Ct
- 5720 Deblyn Ave
- 5800 Deblyn Ave
- 5716 Deblyn Ave
- 5804 Deblyn Ave
- 5725 Deblyn Ave
- 5525 Parkwood Dr
- 5721 Deblyn Ave
- 5519 Parkwood Dr
- 5801 Deblyn Ave
- 5717 Deblyn Ave
- 5531 Parkwood Dr
- 5710 Deblyn Ave
- 5805 Deblyn Ave
- 5808 Deblyn Ave
- 5713 Deblyn Ave
- 5537 Parkwood Dr
- 5706 Deblyn Ave
- 5809 Deblyn Ave
- 5707 Deblyn Ave
- 5507 Parkwood Dr