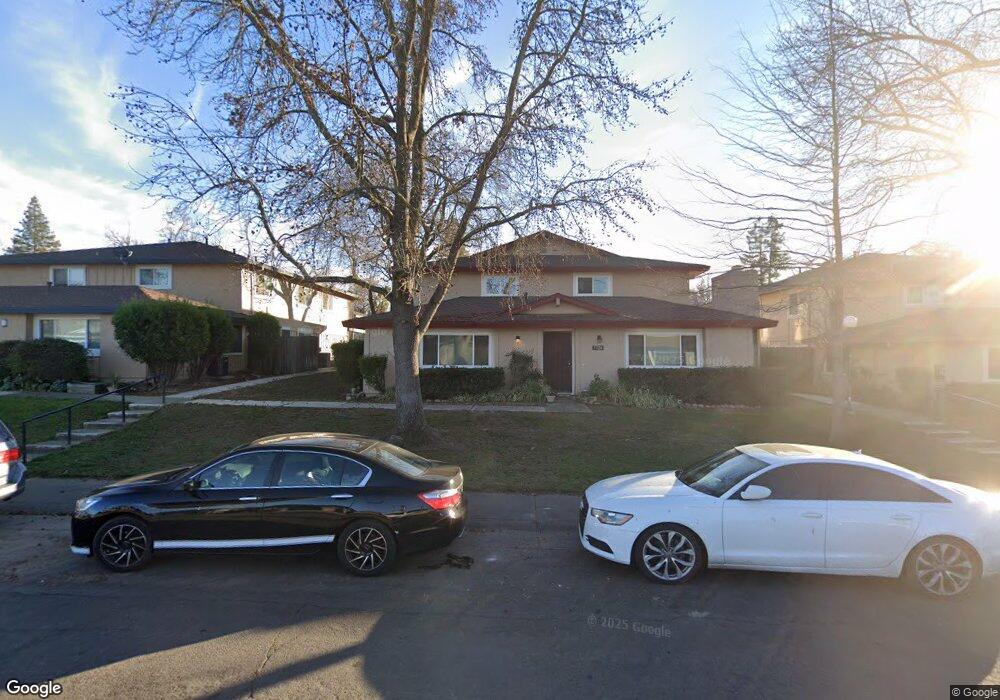
5724 Shadow Creek Dr Unit 1 Sacramento, CA 95841
Haggin Park NeighborhoodEstimated Value: $211,000 - $297,000
2
Beds
1
Bath
956
Sq Ft
$272/Sq Ft
Est. Value
About This Home
This home is located at 5724 Shadow Creek Dr Unit 1, Sacramento, CA 95841 and is currently estimated at $260,048, approximately $272 per square foot. 5724 Shadow Creek Dr Unit 1 is a home located in Sacramento County with nearby schools including Charles Peck Elementary School, Will Rogers Middle School, and San Juan High School.
Ownership History
Date
Name
Owned For
Owner Type
Purchase Details
Closed on
Nov 16, 2005
Sold by
Welch William S and Palmer June A
Bought by
Adham Heather D
Current Estimated Value
Home Financials for this Owner
Home Financials are based on the most recent Mortgage that was taken out on this home.
Original Mortgage
$37,800
Outstanding Balance
$20,749
Interest Rate
6.07%
Mortgage Type
Credit Line Revolving
Estimated Equity
$239,299
Purchase Details
Closed on
Nov 15, 2005
Sold by
Wright Matthew
Bought by
Adham Heather
Home Financials for this Owner
Home Financials are based on the most recent Mortgage that was taken out on this home.
Original Mortgage
$37,800
Outstanding Balance
$20,749
Interest Rate
6.07%
Mortgage Type
Credit Line Revolving
Estimated Equity
$239,299
Purchase Details
Closed on
Nov 4, 2002
Sold by
Welch Edward R
Bought by
Welch Edward R and Welch Revocable Livin Edward R
Create a Home Valuation Report for This Property
The Home Valuation Report is an in-depth analysis detailing your home's value as well as a comparison with similar homes in the area
Home Values in the Area
Average Home Value in this Area
Purchase History
| Date | Buyer | Sale Price | Title Company |
|---|---|---|---|
| Adham Heather D | $189,000 | Fidelity National Title Co | |
| Adham Heather | -- | Fidelity National Title Co | |
| Welch William S | -- | Fidelity National Title Co | |
| Welch Edward R | -- | -- |
Source: Public Records
Mortgage History
| Date | Status | Borrower | Loan Amount |
|---|---|---|---|
| Open | Adham Heather D | $37,800 | |
| Open | Adham Heather D | $151,200 | |
| Closed | Welch William S | $151,200 |
Source: Public Records
Tax History Compared to Growth
Tax History
| Year | Tax Paid | Tax Assessment Tax Assessment Total Assessment is a certain percentage of the fair market value that is determined by local assessors to be the total taxable value of land and additions on the property. | Land | Improvement |
|---|---|---|---|---|
| 2025 | $2,586 | $258,267 | $88,819 | $169,448 |
| 2024 | $2,586 | $214,000 | $65,000 | $149,000 |
| 2023 | $2,436 | $248,240 | $85,371 | $162,869 |
| 2022 | $2,875 | $243,374 | $83,698 | $159,676 |
| 2021 | $1,753 | $150,216 | $37,553 | $112,663 |
| 2020 | $1,545 | $134,122 | $33,530 | $100,592 |
| 2019 | $2,234 | $125,937 | $31,484 | $94,453 |
| 2018 | $2,109 | $118,809 | $29,702 | $89,107 |
| 2017 | $1,264 | $109,000 | $27,250 | $81,750 |
| 2016 | $2,010 | $100,000 | $25,000 | $75,000 |
| 2015 | $1,521 | $136,425 | $46,918 | $89,507 |
| 2014 | $1,965 | $129,929 | $44,684 | $85,245 |
Source: Public Records
Map
Nearby Homes
- 5802 Shadow Creek Dr Unit 1
- 5561 White Fir Way
- 5822 Shadow Creek Dr
- 5317 Manzanita Ave Unit 1
- 5238 Brook Park Ln
- 5836 Peppermill Ct Unit 3
- 5202 Brook Park Ln
- 5372 Garfield Ave
- 5364 Garfield Ave
- 5642 Madison Ave Unit 3
- 5245 Manzanita Ave Unit 2
- 5245 Manzanita Ave Unit 3
- 5942 Ashworth Way
- 5098 Rhode Island Dr
- 5904 Casa Alegre
- 6048 Casa Alegre
- 5907 Casa Alegre
- 5061 Rhode Island Dr Unit 3
- 5931 Via Casitas
- 5097 Connecticut Dr Unit 1
- 5724 Shadow Creek Dr
- 5724 Shadow Creek Dr Unit 4
- 5724 Shadow Creek Dr Unit 2
- 5724 Shadow Creek Dr Unit 3
- 5720 Shadow Creek Dr
- 5720 Shadow Creek Dr Unit 3
- 5720 Shadow Creek Dr Unit 2
- 5720 Shadow Creek Dr Unit 4
- 5720 Shadow Creek Dr Unit 1
- 5728 Shadow Creek Dr
- 5728 Shadow Creek Dr Unit 1
- 5728 Shadow Creek Dr Unit 4
- 5728 Shadow Creek Dr Unit 3
- 5728 Shadow Creek Dr Unit 2
- 5317 Winfield Way Unit 1
- 5317 Winfield Way Unit 4
- 5317 Winfield Way Unit 2
- 5317 Winfield Way Unit 3
- 5716 Shadow Creek Dr
- 5716 Shadow Creek Dr Unit 3