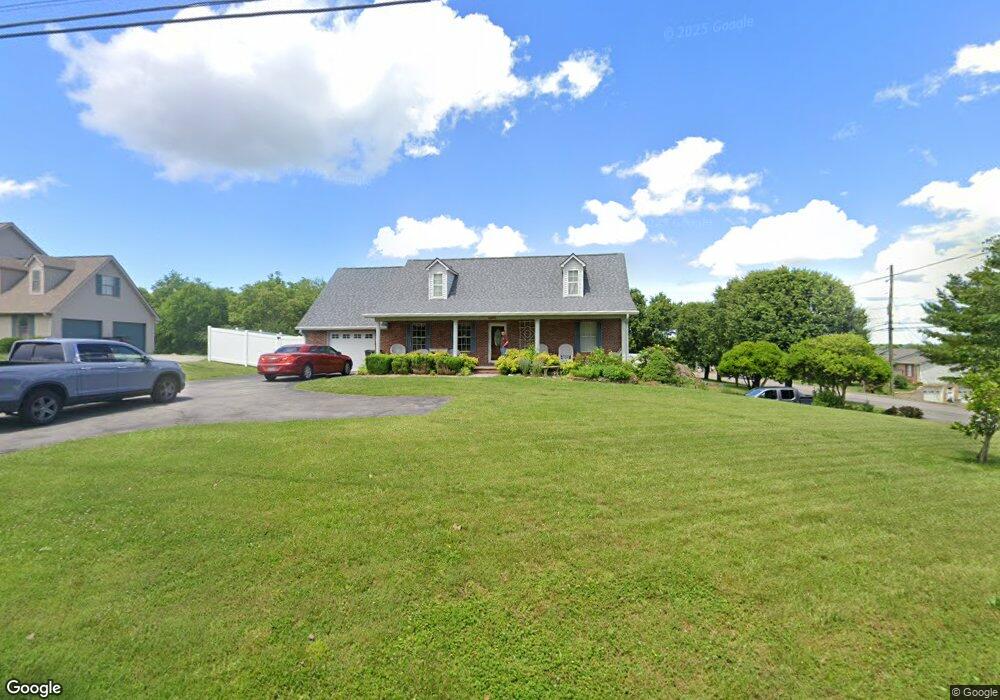
5725 Jarrell Rd Russellville, TN 37860
Estimated Value: $247,000 - $334,000
--
Bed
2
Baths
2,632
Sq Ft
$114/Sq Ft
Est. Value
About This Home
This home is located at 5725 Jarrell Rd, Russellville, TN 37860 and is currently estimated at $299,741, approximately $113 per square foot. 5725 Jarrell Rd is a home located in Hamblen County with nearby schools including Russellville Elementary School, East Ridge Middle School, and Morristown East High School.
Ownership History
Date
Name
Owned For
Owner Type
Purchase Details
Closed on
Aug 26, 2022
Sold by
Gale Carter H and Gale Sharon L
Bought by
Williams David C and Williams Angela Lee
Current Estimated Value
Home Financials for this Owner
Home Financials are based on the most recent Mortgage that was taken out on this home.
Original Mortgage
$45,000
Outstanding Balance
$33,989
Interest Rate
5.51%
Mortgage Type
Balloon
Estimated Equity
$265,752
Purchase Details
Closed on
Aug 18, 1998
Bought by
Carter H Gale H and Carter Sharon L
Purchase Details
Closed on
May 11, 1993
Bought by
Horner Horner C and Horner Earlene
Purchase Details
Closed on
Feb 12, 1993
Bought by
Lawson Bruce Carter
Purchase Details
Closed on
Mar 24, 1987
Bought by
Horner Charles Keith and Horner Geralene
Purchase Details
Closed on
Mar 1, 1962
Create a Home Valuation Report for This Property
The Home Valuation Report is an in-depth analysis detailing your home's value as well as a comparison with similar homes in the area
Home Values in the Area
Average Home Value in this Area
Purchase History
| Date | Buyer | Sale Price | Title Company |
|---|---|---|---|
| Williams David C | $245,000 | New Title Company Name | |
| Carter H Gale H | $106,900 | -- | |
| Horner Horner C | $9,000 | -- | |
| Lawson Bruce Carter | $9,000 | -- | |
| Horner Charles Keith | $68,300 | -- | |
| -- | -- | -- |
Source: Public Records
Mortgage History
| Date | Status | Borrower | Loan Amount |
|---|---|---|---|
| Open | Williams David C | $45,000 |
Source: Public Records
Tax History Compared to Growth
Tax History
| Year | Tax Paid | Tax Assessment Tax Assessment Total Assessment is a certain percentage of the fair market value that is determined by local assessors to be the total taxable value of land and additions on the property. | Land | Improvement |
|---|---|---|---|---|
| 2024 | $871 | $44,225 | $6,150 | $38,075 |
| 2023 | $871 | $44,225 | $0 | $0 |
| 2022 | $871 | $44,225 | $6,150 | $38,075 |
| 2021 | $871 | $44,225 | $6,150 | $38,075 |
| 2020 | $871 | $44,225 | $6,150 | $38,075 |
| 2019 | $816 | $38,300 | $5,875 | $32,425 |
| 2018 | $816 | $38,300 | $5,875 | $32,425 |
| 2017 | $816 | $38,300 | $5,875 | $32,425 |
| 2016 | $762 | $38,300 | $5,875 | $32,425 |
| 2015 | $709 | $38,300 | $5,875 | $32,425 |
| 2014 | -- | $38,300 | $5,875 | $32,425 |
| 2013 | -- | $41,200 | $0 | $0 |
Source: Public Records
Map
Nearby Homes
- 5751 Charlene Dr
- 1290 Little Mountain Rd
- 1341 Little Mountain Rd
- Tract 3 Shinbone Rd
- Tract 4 Shinbone Rd
- 1976/1986 Shinbone Rd
- Tract 2 Shinbone Rd
- 1475 Shinbone Rd
- 00 Shinbone E Sugar Hollow Rd
- 814 Pullen Rd
- 1342 Slop Creek Rd
- 5740 Dodson Ferry Rd
- 5790 N 2nd St
- 6284 Old Russellville Pike
- 6330 Old Russellville Pike
- 1041 Wilburn Rd
- 670 Jones Franklin Rd
- 233 Harvey Dr
- 6563 E Andrew Johnson Hwy
- 5709 Jarrell Rd
- 1089 Beth Dr
- 5699 Jarrell Rd
- 5735 Jarrell Rd
- 1088 Beth Dr
- 1079 Beth Dr
- 1078 Beth Dr
- 1069 Beth Dr
- 5687 Jarrell Rd
- 1068 Beth Dr
- 5740 Jarrell Rd
- 1059 Beth Dr
- 5751 Jarrell Rd
- 1058 Beth Dr
- 5700 Jarrell Rd
- 1049 Beth Dr
- 1154 Little Mountain Rd
- 1146 Little Mountain Rd
- 5720 Charlene Dr
- 1142 Little Mountain Rd