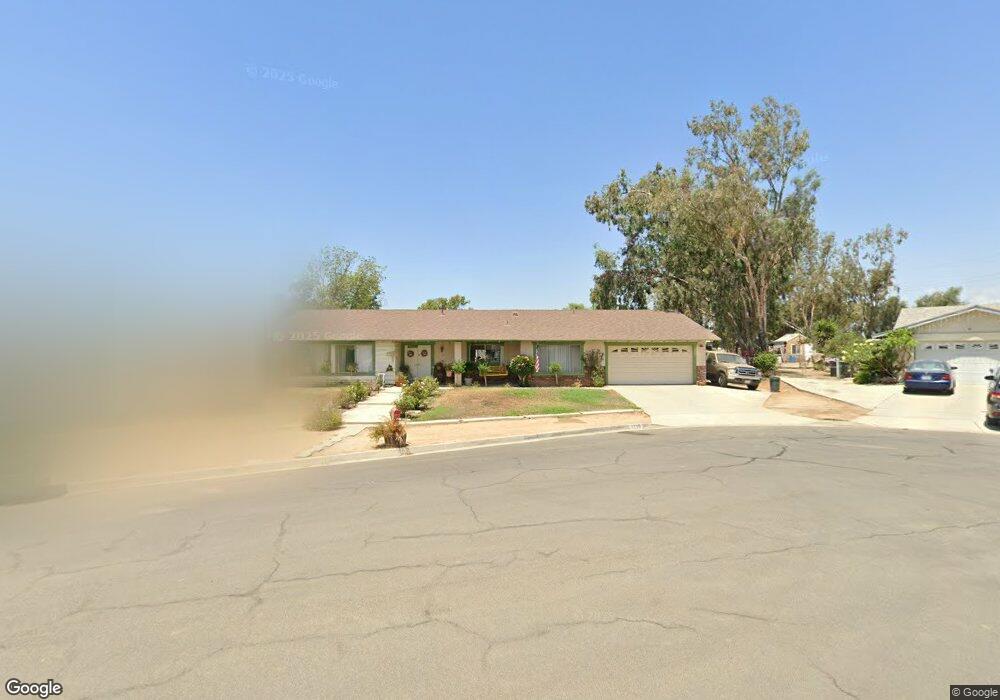
5725 Polaris Ct Mira Loma, CA 91752
Estimated Value: $704,000 - $856,000
3
Beds
2
Baths
1,408
Sq Ft
$543/Sq Ft
Est. Value
About This Home
This home is located at 5725 Polaris Ct, Mira Loma, CA 91752 and is currently estimated at $764,103, approximately $542 per square foot. 5725 Polaris Ct is a home located in Riverside County with nearby schools including Sky Country Elementary School, Mira Loma Middle School, and Jurupa Valley High School.
Ownership History
Date
Name
Owned For
Owner Type
Purchase Details
Closed on
Jul 10, 1998
Sold by
Alfonso Chavez
Bought by
Zavala Robert F and Zavala Leticia I
Current Estimated Value
Home Financials for this Owner
Home Financials are based on the most recent Mortgage that was taken out on this home.
Original Mortgage
$155,790
Interest Rate
6.69%
Mortgage Type
FHA
Purchase Details
Closed on
Feb 6, 1995
Sold by
Federal Home Loan Mortgage Corporation
Bought by
Chavez Alfonso
Home Financials for this Owner
Home Financials are based on the most recent Mortgage that was taken out on this home.
Original Mortgage
$128,700
Interest Rate
9.27%
Mortgage Type
Purchase Money Mortgage
Purchase Details
Closed on
Sep 21, 1994
Sold by
High William R Pete and High Michael E
Bought by
Federal Home Loan Mortgage Corporation
Purchase Details
Closed on
Jun 17, 1994
Sold by
High Michael
Bought by
Chavez Alfonso
Create a Home Valuation Report for This Property
The Home Valuation Report is an in-depth analysis detailing your home's value as well as a comparison with similar homes in the area
Home Values in the Area
Average Home Value in this Area
Purchase History
| Date | Buyer | Sale Price | Title Company |
|---|---|---|---|
| Zavala Robert F | $161,000 | Commonwealth Land Title Co | |
| Chavez Alfonso | $136,000 | Continental Lawyers Title Co | |
| Federal Home Loan Mortgage Corporation | $125,000 | First Southwestern Title Co | |
| Chavez Alfonso | -- | -- |
Source: Public Records
Mortgage History
| Date | Status | Borrower | Loan Amount |
|---|---|---|---|
| Previous Owner | Zavala Robert F | $155,790 | |
| Previous Owner | Chavez Alfonso | $128,700 |
Source: Public Records
Tax History Compared to Growth
Tax History
| Year | Tax Paid | Tax Assessment Tax Assessment Total Assessment is a certain percentage of the fair market value that is determined by local assessors to be the total taxable value of land and additions on the property. | Land | Improvement |
|---|---|---|---|---|
| 2025 | $2,698 | $252,368 | $86,205 | $166,163 |
| 2023 | $2,698 | $242,569 | $82,858 | $159,711 |
| 2022 | $2,648 | $237,814 | $81,234 | $156,580 |
| 2021 | $2,629 | $233,152 | $79,642 | $153,510 |
| 2020 | $2,604 | $230,762 | $78,826 | $151,936 |
| 2019 | $2,552 | $226,238 | $77,281 | $148,957 |
| 2018 | $2,470 | $221,803 | $75,767 | $146,036 |
| 2017 | $2,443 | $217,455 | $74,282 | $143,173 |
| 2016 | $2,408 | $213,192 | $72,826 | $140,366 |
| 2015 | $2,375 | $209,991 | $71,733 | $138,258 |
| 2014 | $2,214 | $205,879 | $70,329 | $135,550 |
Source: Public Records
Map
Nearby Homes
- 11187 58th St
- 5685 Ptolemy Way
- 5853 Aurora Ave
- 0 Etiwanda Ave & 54th St Unit DW25195682
- 5286 Trail Canyon Dr
- 11101 Gemini Ct
- 5621 Avocet Dr
- 5594 Skimmer Dr
- 5599 Skimmer Dr
- 11877 Crossbill Way
- 6323 Smith Ave
- 11915 Berlyn Dove Ct
- 6415 Etiwanda Ave
- 6093 Troth St
- 10538 54th St
- 11913 Solitaire Ct
- 4991 Graphite Creek Rd
- 11416 Holmes Ave Unit 3
- 11958 Sunstone Ct
- 4900 Eclipse Ave
- 5745 Polaris Ct
- 5700 Polaris Ct
- 5744 Lucretia Ave
- 5760 Lucretia Ave
- 5734 Lucretia Ave
- 5785 Polaris Ct
- 5740 Polaris Ct
- 5772 Lucretia Ave
- 5760 Polaris Ct
- 11310 Sirius Way
- 11330 Sirius Way
- 5805 Polaris Ct
- 11290 Sirius Way
- 5780 Polaris Ct
- 5800 Lucretia Ave
- 5800 Polaris Ct
- 11270 Sirius Way
- 5747 Lucretia Ave
- 11155 Little Dipper St
- 11175 Little Dipper St