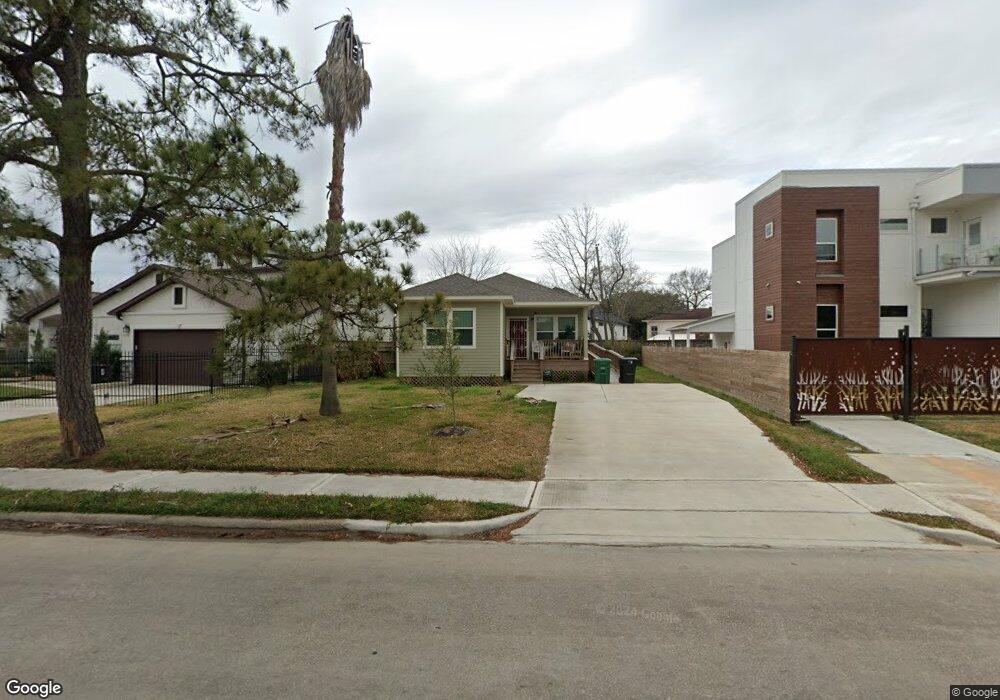
5726 Cullen Blvd Houston, TX 77021
MacGregor NeighborhoodEstimated Value: $320,000 - $484,000
3
Beds
3
Baths
1,278
Sq Ft
$305/Sq Ft
Est. Value
About This Home
This home is located at 5726 Cullen Blvd, Houston, TX 77021 and is currently estimated at $390,211, approximately $305 per square foot. 5726 Cullen Blvd is a home located in Harris County with nearby schools including Peck Elementary School, Cullen Middle School, and Yates High School.
Ownership History
Date
Name
Owned For
Owner Type
Purchase Details
Closed on
Jul 14, 2007
Sold by
Wilson Ray F and Wilson Faye D
Bought by
Williams Lenora
Current Estimated Value
Home Financials for this Owner
Home Financials are based on the most recent Mortgage that was taken out on this home.
Original Mortgage
$155,000
Outstanding Balance
$97,082
Interest Rate
6.54%
Mortgage Type
Seller Take Back
Estimated Equity
$293,129
Purchase Details
Closed on
Dec 27, 2006
Sold by
Wilson Ray F
Bought by
Wilson Roy A and Pettis Sandra
Home Financials for this Owner
Home Financials are based on the most recent Mortgage that was taken out on this home.
Original Mortgage
$30,000
Interest Rate
6.27%
Mortgage Type
Seller Take Back
Purchase Details
Closed on
Dec 27, 1993
Sold by
Wilson Ray F
Bought by
Wilson Roy A and Pettis Sandra
Home Financials for this Owner
Home Financials are based on the most recent Mortgage that was taken out on this home.
Original Mortgage
$30,000
Interest Rate
7.16%
Mortgage Type
Seller Take Back
Create a Home Valuation Report for This Property
The Home Valuation Report is an in-depth analysis detailing your home's value as well as a comparison with similar homes in the area
Home Values in the Area
Average Home Value in this Area
Purchase History
| Date | Buyer | Sale Price | Title Company |
|---|---|---|---|
| Williams Lenora | -- | None Available | |
| Wilson Roy A | -- | None Available | |
| Wilson Roy A | -- | -- |
Source: Public Records
Mortgage History
| Date | Status | Borrower | Loan Amount |
|---|---|---|---|
| Open | Williams Lenora | $155,000 | |
| Previous Owner | Wilson Roy A | $30,000 | |
| Previous Owner | Wilson Roy A | $30,000 |
Source: Public Records
Tax History Compared to Growth
Tax History
| Year | Tax Paid | Tax Assessment Tax Assessment Total Assessment is a certain percentage of the fair market value that is determined by local assessors to be the total taxable value of land and additions on the property. | Land | Improvement |
|---|---|---|---|---|
| 2025 | $949 | $406,916 | $220,080 | $186,836 |
| 2024 | $949 | $406,916 | $220,080 | $186,836 |
| 2023 | $949 | $405,131 | $220,080 | $185,051 |
| 2022 | $8,014 | $391,035 | $220,080 | $170,955 |
| 2021 | $7,328 | $314,434 | $157,200 | $157,234 |
| 2020 | $5,046 | $202,476 | $157,200 | $45,276 |
| 2019 | $4,785 | $180,861 | $135,585 | $45,276 |
| 2018 | $735 | $167,648 | $117,900 | $49,748 |
| 2017 | $4,432 | $167,648 | $117,900 | $49,748 |
| 2016 | $4,147 | $167,648 | $117,900 | $49,748 |
| 2015 | $1,056 | $142,627 | $86,460 | $56,167 |
| 2014 | $1,056 | $138,647 | $86,460 | $52,187 |
Source: Public Records
Map
Nearby Homes
- 4327 Alconbury Ln
- 4211 Charleston St
- 4107 Charleston St
- 4302 Fernwood Dr
- 4310 Fernwood Dr
- 4315 Fernwood Dr
- 4435 Old Spanish Trail
- 4031 Fernwood Dr
- 4014 England Ct E
- 0 S Macgregor Way Unit 94380145
- 5811 Eastwood St
- 4711 Marietta Ln
- 4735 Marietta Ln
- 3917, 3919 Griggs Rd
- 4013 Griggs Rd Unit E
- 4013 Griggs Rd Unit D
- 3827 Julius Ln
- 4826 Culmore Dr
- 4807 Eppes St
- 3902 Charleston St
- 5722 Cullen Blvd Unit A
- 5722 Cullen Bl
- 5722 Cullen Blvd
- 5722 Cullen Blvd Unit B
- 5730 Cullen Blvd
- 4118 Charleston St
- 4202 Charleston St
- 5734 Cullen Blvd
- 4208 Charleston St
- 4110 Charleston St
- 4302 Alconbury Ln
- 4212 Charleston St
- 5738 Cullen Bl
- 4108 Charleston St
- 4301 Alconbury Ln
- 4304 Alconbury Ln
- 4304 S Alconbury Ln
- 4059 Glen Cove Dr
- 4216 Charleston St
- 4303 Alconbury Ln