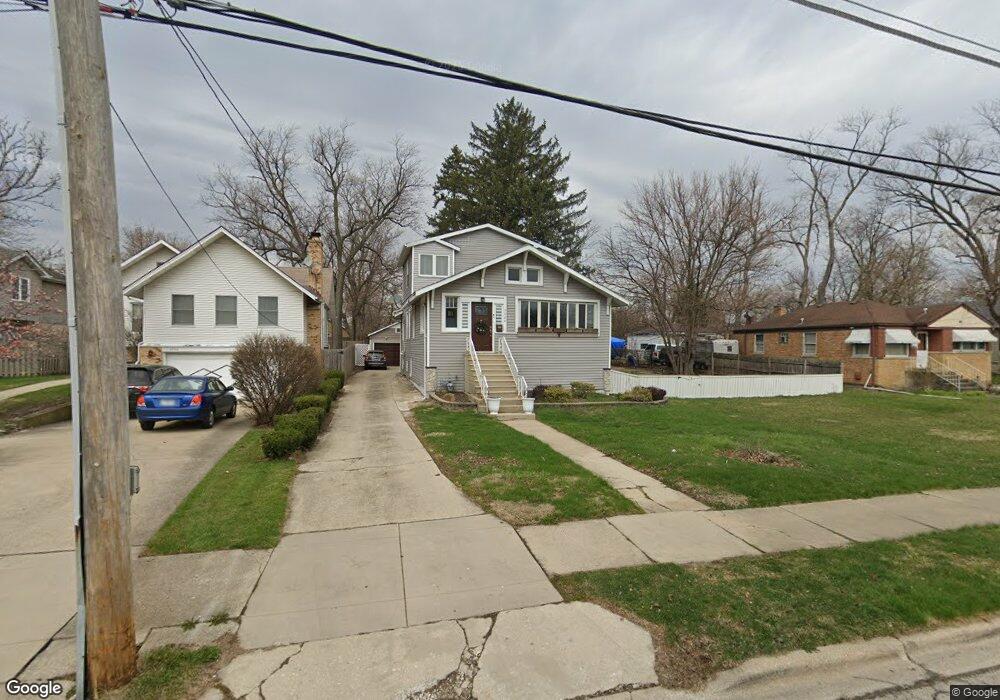
5726 W Maple Ave Berkeley, IL 60163
Estimated Value: $317,599 - $344,000
4
Beds
2
Baths
1,558
Sq Ft
$212/Sq Ft
Est. Value
About This Home
This home is located at 5726 W Maple Ave, Berkeley, IL 60163 and is currently estimated at $330,150, approximately $211 per square foot. 5726 W Maple Ave is a home located in Cook County with nearby schools including Macarthur Intermediate School, Sunnyside Elementary School, and Proviso West High School.
Ownership History
Date
Name
Owned For
Owner Type
Purchase Details
Closed on
Jul 11, 2007
Sold by
Smith Roger A and Smith Roger
Bought by
Smith Roger A and Smith Sharon E
Current Estimated Value
Home Financials for this Owner
Home Financials are based on the most recent Mortgage that was taken out on this home.
Original Mortgage
$262,400
Outstanding Balance
$138,432
Interest Rate
3.92%
Mortgage Type
New Conventional
Estimated Equity
$191,718
Purchase Details
Closed on
Dec 22, 2006
Sold by
Carrera Joaquin and Carrera Del Valle
Bought by
Smith Roger
Home Financials for this Owner
Home Financials are based on the most recent Mortgage that was taken out on this home.
Original Mortgage
$270,655
Interest Rate
9.35%
Mortgage Type
Balloon
Purchase Details
Closed on
Dec 19, 2006
Sold by
Enriquez Roberto G
Bought by
Carrera Joaquin and Carrera Del Valle
Home Financials for this Owner
Home Financials are based on the most recent Mortgage that was taken out on this home.
Original Mortgage
$270,655
Interest Rate
9.35%
Mortgage Type
Balloon
Create a Home Valuation Report for This Property
The Home Valuation Report is an in-depth analysis detailing your home's value as well as a comparison with similar homes in the area
Home Values in the Area
Average Home Value in this Area
Purchase History
| Date | Buyer | Sale Price | Title Company |
|---|---|---|---|
| Smith Roger A | -- | First American Title | |
| Smith Roger | $285,000 | Pntn | |
| Carrera Joaquin | $178,000 | Pntn |
Source: Public Records
Mortgage History
| Date | Status | Borrower | Loan Amount |
|---|---|---|---|
| Open | Smith Roger A | $262,400 | |
| Closed | Smith Roger | $270,655 |
Source: Public Records
Tax History
| Year | Tax Paid | Tax Assessment Tax Assessment Total Assessment is a certain percentage of the fair market value that is determined by local assessors to be the total taxable value of land and additions on the property. | Land | Improvement |
|---|---|---|---|---|
| 2025 | $8,163 | $28,000 | $12,705 | $15,295 |
| 2024 | $8,163 | $28,000 | $12,705 | $15,295 |
| 2023 | $5,070 | $28,000 | $12,705 | $15,295 |
| 2022 | $5,070 | $21,093 | $8,663 | $12,430 |
| 2021 | $5,125 | $17,696 | $8,662 | $9,034 |
| 2020 | $6,027 | $17,696 | $8,662 | $9,034 |
| 2019 | $5,606 | $16,656 | $8,085 | $8,571 |
| 2018 | $5,494 | $16,656 | $8,085 | $8,571 |
| 2017 | $5,275 | $16,656 | $8,085 | $8,571 |
| 2016 | $4,895 | $14,589 | $7,507 | $7,082 |
| 2015 | $4,830 | $14,589 | $7,507 | $7,082 |
| 2014 | $4,763 | $14,589 | $7,507 | $7,082 |
| 2013 | $4,666 | $15,372 | $7,507 | $7,865 |
Source: Public Records
Map
Nearby Homes
- 4938 W Randolph St
- 1447 N Ashbel Ave
- 1529 N Hillside Ave
- 1428 1/2 N Ashbel Ave
- 504 N Irving Ave
- 4904 W Hawthorne Ave
- 5706 Saint Charles Rd
- 5700 Saint Charles Rd
- 593 S Edgewood Ave
- 605 N Wolf Rd Unit B9
- 520 N Wolf Rd Unit 203
- 515 S Parkview Ave
- 250 N Irving Ave
- 2050 Atwood Ave
- 768 N Rohde Ave
- 226 N Lind Ave
- 522 E Park Manor Ct
- 1463 Speechley Blvd
- 1038 Arthur Ave
- 4530 Butterfield Rd
- 5732 W Maple Ave
- 5722 W Maple Ave
- 5736 W Maple Ave
- 5710 W Maple Ave
- 1631 N Taft Ave
- 5733 W Maple Ave
- 5725 W Maple Ave
- 5737 W Maple Ave
- 5708 W Maple Ave
- 5721 W Maple Ave
- 1701 N Taft Ave
- 5717 W Maple Ave
- 1703 N Taft Ave
- 5704 W Maple Ave
- 5711 W Maple Ave
- 1617 N Taft Ave
- 1612 Birch Dr
- 5728 Rose Ct
- 5732 Rose Ct
- 5724 Rose Ct
Your Personal Tour Guide
Ask me questions while you tour the home.