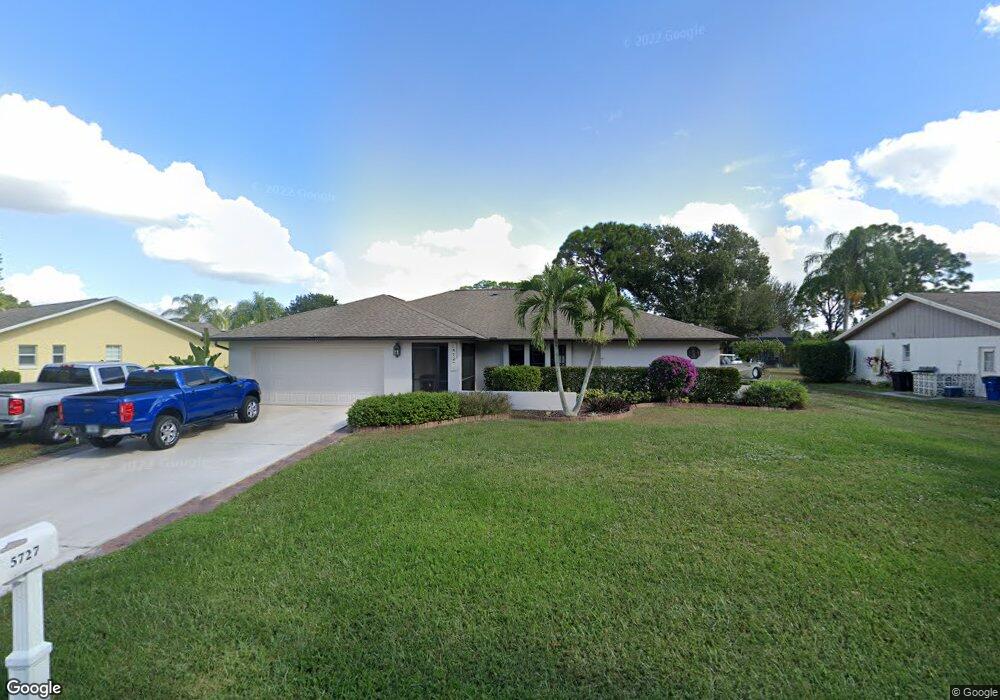
5727 Stonehaven Dr North Fort Myers, FL 33903
Hancock NeighborhoodEstimated Value: $371,000 - $473,000
4
Beds
2
Baths
3,515
Sq Ft
$117/Sq Ft
Est. Value
About This Home
This home is located at 5727 Stonehaven Dr, North Fort Myers, FL 33903 and is currently estimated at $411,022, approximately $116 per square foot. 5727 Stonehaven Dr is a home located in Lee County with nearby schools including Tropic Isles Elementary School, Hancock Creek Elementary School, and Caloosa Elementary School.
Ownership History
Date
Name
Owned For
Owner Type
Purchase Details
Closed on
Jun 25, 2007
Sold by
Beckett Timothy and Beckett Sherrye T
Bought by
Morgan Randy and Morgan Kelli
Current Estimated Value
Home Financials for this Owner
Home Financials are based on the most recent Mortgage that was taken out on this home.
Original Mortgage
$247,500
Outstanding Balance
$152,752
Interest Rate
6.35%
Mortgage Type
Unknown
Estimated Equity
$258,270
Purchase Details
Closed on
Sep 30, 1996
Sold by
Jane Gigak Terry R and Jane Gigak Mary
Bought by
Beckett Timothy and Beckett Sherrye T
Home Financials for this Owner
Home Financials are based on the most recent Mortgage that was taken out on this home.
Original Mortgage
$108,000
Interest Rate
7.87%
Purchase Details
Closed on
Apr 17, 1995
Sold by
Yeatter Tad M and Yeatter Lisa K
Bought by
Gigax Terry R and Gigax Mary Jane
Home Financials for this Owner
Home Financials are based on the most recent Mortgage that was taken out on this home.
Original Mortgage
$125,850
Interest Rate
8.49%
Create a Home Valuation Report for This Property
The Home Valuation Report is an in-depth analysis detailing your home's value as well as a comparison with similar homes in the area
Home Values in the Area
Average Home Value in this Area
Purchase History
| Date | Buyer | Sale Price | Title Company |
|---|---|---|---|
| Morgan Randy | $275,000 | Palm Title Associates Inc | |
| Beckett Timothy | $137,000 | -- | |
| Gigax Terry R | $132,500 | -- |
Source: Public Records
Mortgage History
| Date | Status | Borrower | Loan Amount |
|---|---|---|---|
| Open | Morgan Randy | $247,500 | |
| Previous Owner | Beckett Timothy | $108,000 | |
| Previous Owner | Gigax Terry R | $125,850 |
Source: Public Records
Tax History Compared to Growth
Tax History
| Year | Tax Paid | Tax Assessment Tax Assessment Total Assessment is a certain percentage of the fair market value that is determined by local assessors to be the total taxable value of land and additions on the property. | Land | Improvement |
|---|---|---|---|---|
| 2025 | $1,890 | $147,708 | -- | -- |
| 2024 | $1,819 | $143,545 | -- | -- |
| 2023 | $1,819 | $139,364 | $0 | $0 |
| 2022 | $1,945 | $135,305 | $0 | $0 |
| 2021 | $1,875 | $259,902 | $25,969 | $233,933 |
| 2020 | $1,878 | $129,550 | $0 | $0 |
| 2019 | $1,836 | $126,637 | $0 | $0 |
| 2018 | $1,822 | $124,276 | $0 | $0 |
| 2017 | $1,816 | $121,720 | $0 | $0 |
| 2016 | $1,679 | $191,108 | $19,275 | $171,833 |
| 2015 | $1,694 | $165,804 | $17,156 | $148,648 |
| 2014 | $1,673 | $162,801 | $17,170 | $145,631 |
| 2013 | -- | $154,501 | $15,548 | $138,953 |
Source: Public Records
Map
Nearby Homes
- 315 SE 24th Ave
- 217 SE 24th Ave
- 5905 Untermeyer Ct
- 2113 Lochmoor Cir Unit 4
- 2309 SE 3rd St
- 4380 Saint Clair Ave W
- 4344 Saint Clair Ave W
- 502 SE 24th Ave
- 2303 SE 3rd St
- 508 SE 24th Ave
- 118 SE 23rd Place
- 2063 W Lakeview Blvd Unit 2
- 2220 SE 2nd Terrace
- 508 SE 23rd Place
- 2067 W Lakeview Blvd Unit 10
- 2067 W Lakeview Blvd Unit 8
- 615 SE 23rd Place
- 4777 Orange Grove Blvd Unit 5
- 4555 Vinsetta Ave
- 4517 Vinsetta Ave
- 5721 Stonehaven Dr
- 5733 Stonehaven Dr
- 5819 Inverness Cir
- 5722 Galloway Dr
- 5715 Stonehaven Dr
- 5728 Stonehaven Dr
- 5722 Stonehaven Dr
- 5716 Galloway Dr
- 5734 Stonehaven Dr Unit IV
- 5806 Inverness Cir
- 5812 Inverness Cir
- 5716 Stonehaven Dr
- 5709 Stonehaven Dr
- 5800 Inverness Cir
- 5789 Inverness Cir
- 5818 Inverness Cir
- 5710 Galloway Dr
- 5794 Inverness Cir
- 5710 Stonehaven Dr
- 5733 Inverness Cir