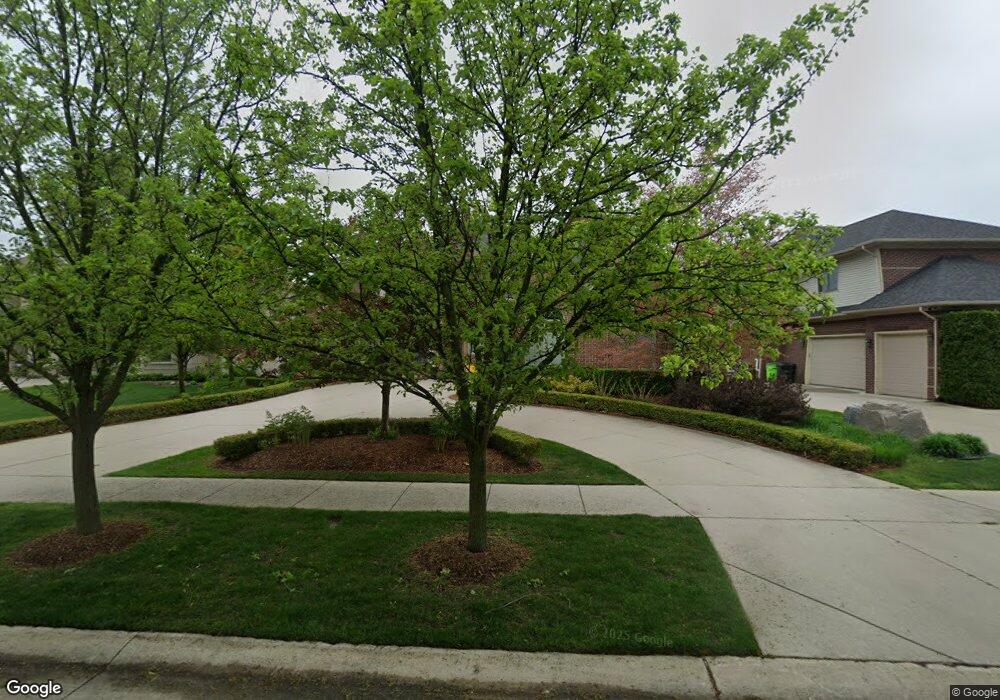
57276 Stonebriar Dr Washington, MI 48094
Estimated Value: $743,000 - $857,000
4
Beds
4
Baths
4,200
Sq Ft
$190/Sq Ft
Est. Value
About This Home
This home is located at 57276 Stonebriar Dr, Washington, MI 48094 and is currently estimated at $797,944, approximately $189 per square foot. 57276 Stonebriar Dr is a home located in Macomb County with nearby schools including Richard J. Duncan Elementary, Malow Junior High School, and Eisenhower High School.
Ownership History
Date
Name
Owned For
Owner Type
Purchase Details
Closed on
May 12, 2025
Sold by
Moran Brian P
Bought by
Moran Emily K
Current Estimated Value
Purchase Details
Closed on
Dec 6, 2011
Sold by
Locricchio Salvatore and Salvatore Locricchio Revocable
Bought by
Moran Brian P
Purchase Details
Closed on
Sep 28, 2011
Sold by
Locricchio Salvatore and Locricchio Carol A
Bought by
Loricchio Salvatore and Salvatore Locricchio Revocable
Home Financials for this Owner
Home Financials are based on the most recent Mortgage that was taken out on this home.
Original Mortgage
$376,800
Interest Rate
4.01%
Mortgage Type
New Conventional
Purchase Details
Closed on
Dec 20, 2001
Sold by
Polo Homes Co Inc
Bought by
Palazzolo Vincent
Purchase Details
Closed on
Apr 17, 2001
Sold by
Stonebriar Development C
Bought by
Polo Homes Inc
Create a Home Valuation Report for This Property
The Home Valuation Report is an in-depth analysis detailing your home's value as well as a comparison with similar homes in the area
Home Values in the Area
Average Home Value in this Area
Purchase History
| Date | Buyer | Sale Price | Title Company |
|---|---|---|---|
| Moran Emily K | -- | None Listed On Document | |
| Moran Emily K | -- | None Listed On Document | |
| Moran Brian P | $471,000 | First American Title Ins Co | |
| Loricchio Salvatore | -- | None Available | |
| Palazzolo Vincent | $105,000 | -- | |
| Polo Homes Inc | $80,000 | -- |
Source: Public Records
Mortgage History
| Date | Status | Borrower | Loan Amount |
|---|---|---|---|
| Previous Owner | Loricchio Salvatore | $376,800 |
Source: Public Records
Tax History Compared to Growth
Tax History
| Year | Tax Paid | Tax Assessment Tax Assessment Total Assessment is a certain percentage of the fair market value that is determined by local assessors to be the total taxable value of land and additions on the property. | Land | Improvement |
|---|---|---|---|---|
| 2025 | $7,535 | $381,600 | $0 | $0 |
| 2024 | $4,531 | $377,500 | $0 | $0 |
| 2023 | $4,291 | $330,400 | $0 | $0 |
| 2022 | $6,701 | $305,300 | $0 | $0 |
| 2021 | $6,525 | $291,900 | $0 | $0 |
| 2020 | $3,950 | $265,600 | $0 | $0 |
| 2019 | $5,963 | $255,500 | $0 | $0 |
| 2018 | $5,898 | $254,200 | $0 | $0 |
| 2017 | $5,801 | $249,100 | $46,000 | $203,100 |
| 2016 | $5,773 | $249,100 | $0 | $0 |
| 2015 | -- | $225,500 | $0 | $0 |
| 2013 | $4,766 | $229,000 | $30,000 | $199,000 |
| 2012 | $4,766 | $189,100 | $0 | $0 |
Source: Public Records
Map
Nearby Homes
- 57563 Stonebriar Dr
- 13987 Quail View Dr
- 57116 Veridian Dr
- 13970 Quail View Dr
- 57290 Veridian Blvd
- 57011 Veridian Blvd
- The Berkley Plan at Veridian - The Estates
- Cambridge Plan at Veridian - Villas
- The Kirkway I Plan at Veridian - The Estates
- The Stratford I Plan at Veridian - The Estates
- The Oxford I Plan at Veridian - The Estates
- The Kirkway II Plan at Veridian - The Estates
- Kirkwood Plan at Veridian - Villas
- Thorington Plan at Veridian - Villas
- The Orchard II Plan at Veridian - The Estates
- The Oxford II Plan at Veridian - The Estates
- The Somerset Plan at Veridian - The Estates
- The Orchard I Plan at Veridian - The Estates
- Devonshire Plan at Veridian - Villas
- 13953 Quail View Dr
- 57298 Stonebriar Dr
- 57254 Stonebriar Dr
- 57320 Stonebriar Dr
- 57232 Stonebriar Dr
- 57319 Ridgewood Dr
- 13215 Woodside Dr
- 57342 Stonebriar Dr
- 57210 Stonebriar Dr
- 13197 Woodside Dr
- 57341 Ridgewood Dr
- 57239 Stonebriar Dr
- 57188 Stonebriar Dr
- 57340 Ridgewood Dr
- 57364 Stonebriar Dr
- 57363 Ridgewood Dr
- 57217 Stonebriar Dr
- 13171 Woodside Dr
- 57166 Stonebriar Dr
- 57362 Ridgewood Dr
- 57166 Stonebriar Dive