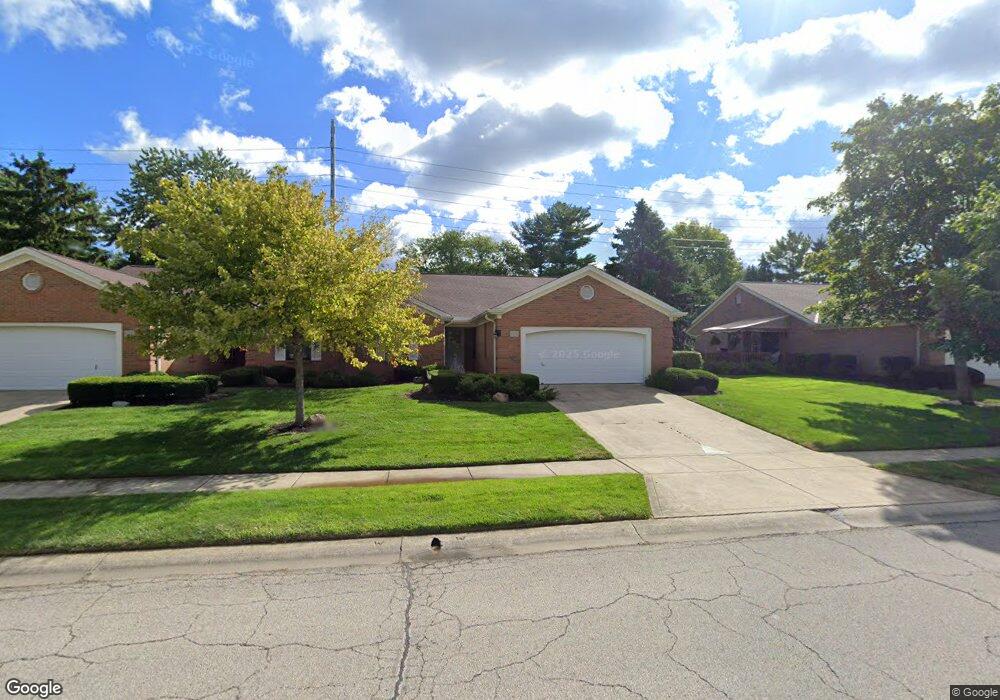
5728 Barry Trace Unit 5728 Dublin, OH 43017
Estimated Value: $403,582 - $440,000
2
Beds
2
Baths
1,883
Sq Ft
$227/Sq Ft
Est. Value
About This Home
This home is located at 5728 Barry Trace Unit 5728, Dublin, OH 43017 and is currently estimated at $428,146, approximately $227 per square foot. 5728 Barry Trace Unit 5728 is a home located in Franklin County with nearby schools including Thomas Elementary School, John Sells Middle School, and Dublin Coffman High School.
Ownership History
Date
Name
Owned For
Owner Type
Purchase Details
Closed on
May 12, 2022
Sold by
Brown Patricia L
Bought by
Falleur Michael D
Current Estimated Value
Purchase Details
Closed on
May 4, 2022
Sold by
Brown Patricia L
Bought by
Falleur Michael D
Purchase Details
Closed on
Apr 21, 2009
Sold by
Brown John K and Brown Patricia L
Bought by
Brown Patricia L
Purchase Details
Closed on
Aug 19, 2008
Sold by
Curtis Mavis M
Bought by
Brown John K and Brown Patricia L
Purchase Details
Closed on
Nov 23, 1994
Sold by
Raymond Barry Inc
Bought by
Mavis M Curtis
Home Financials for this Owner
Home Financials are based on the most recent Mortgage that was taken out on this home.
Original Mortgage
$50,000
Interest Rate
7.25%
Mortgage Type
New Conventional
Create a Home Valuation Report for This Property
The Home Valuation Report is an in-depth analysis detailing your home's value as well as a comparison with similar homes in the area
Home Values in the Area
Average Home Value in this Area
Purchase History
| Date | Buyer | Sale Price | Title Company |
|---|---|---|---|
| Falleur Michael D | $355,000 | New Title Company Name | |
| Falleur Michael D | $355,000 | New Title Company Name | |
| Brown Patricia L | -- | Attorney | |
| Brown John K | $224,000 | Talon Group | |
| Mavis M Curtis | $184,800 | -- |
Source: Public Records
Mortgage History
| Date | Status | Borrower | Loan Amount |
|---|---|---|---|
| Previous Owner | Mavis M Curtis | $50,000 | |
| Closed | Brown John K | $0 |
Source: Public Records
Tax History
| Year | Tax Paid | Tax Assessment Tax Assessment Total Assessment is a certain percentage of the fair market value that is determined by local assessors to be the total taxable value of land and additions on the property. | Land | Improvement |
|---|---|---|---|---|
| 2025 | $6,885 | $113,830 | $23,280 | $90,550 |
| 2024 | $6,885 | $113,830 | $23,280 | $90,550 |
| 2023 | $6,788 | $113,820 | $23,275 | $90,545 |
| 2022 | $5,857 | $100,030 | $25,200 | $74,830 |
| 2021 | $5,952 | $100,030 | $25,200 | $74,830 |
| 2020 | $5,916 | $100,030 | $25,200 | $74,830 |
| 2019 | $5,463 | $83,370 | $21,000 | $62,370 |
| 2018 | $5,022 | $83,370 | $21,000 | $62,370 |
| 2017 | $5,044 | $83,370 | $21,000 | $62,370 |
| 2016 | $4,531 | $71,720 | $12,710 | $59,010 |
| 2015 | $4,560 | $71,720 | $12,710 | $59,010 |
| 2014 | $4,564 | $71,720 | $12,710 | $59,010 |
| 2013 | $2,077 | $65,205 | $11,550 | $53,655 |
Source: Public Records
Map
Nearby Homes
- 5657 Barry Trace
- 3166 Kingstree Ct
- 5734 Kingstree Dr
- 5790 Newgate Rd Unit 5790
- 5735 Newbank Cir Unit 303
- 3282 Welsh Abbey Rd Unit 3282
- 2744 Greystone Dr Unit E
- 4385 Hayden Falls Dr
- 2622 Trottersway Dr
- 2733 Greystone Dr Unit D
- 2579 Trotterslane Dr
- 2585 Trottersway Dr Unit 2585
- 6220 Emberwood Rd
- 2560 Trotterslane Dr
- 6171 Water Bank St
- 5570 Coogan Place
- 3263 Scioto Ridge Rd
- 2542 Hyacinth Ln Unit 32C
- 2540 Dahlia Way Unit 26D
- 5355 Ambrosia Ave Unit 107C
- 5730 Barry Trace Unit 5730
- 5716 Barry Trace Unit 5716
- 5742 Barry Trace Unit 5742
- 5714 Barry Trace Unit 5714
- 5744 Barry Trace Unit 5744
- 5721 Barry Trace
- 5723 Barry Trace Unit 5723
- 5719 Barry Trace
- 5702 Barry Trace Unit 5702
- 5711 Barry Trace
- 5735 Barry Trace Unit 5735
- 5379 Harvest St
- 5737 Barry Trace
- 5750 Barry Trace Unit 5750
- 5391 Harvest St
- 5709 Barry Trace Unit 5709
- 5700 Barry Trace
- 5395 Harvest St
- 5373 Harvest St
- 5752 Barry Trace Unit 5752