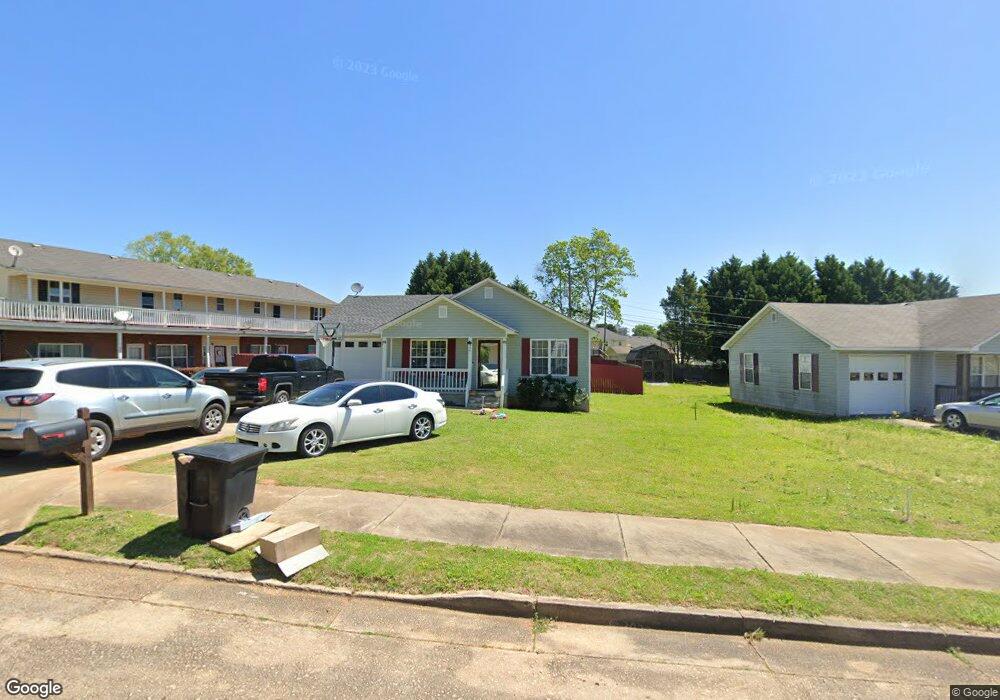
573 2nd Ave Thomaston, GA 30286
Estimated Value: $127,000 - $199,000
3
Beds
2
Baths
1,204
Sq Ft
$138/Sq Ft
Est. Value
About This Home
This home is located at 573 2nd Ave, Thomaston, GA 30286 and is currently estimated at $166,089, approximately $137 per square foot. 573 2nd Ave is a home located in Upson County with nearby schools including Upson-Lee South Elementary School, Upson-Lee North Elementary School, and Upson-Lee Middle School.
Ownership History
Date
Name
Owned For
Owner Type
Purchase Details
Closed on
Mar 28, 2007
Sold by
Hammond Matthew D
Bought by
Graddick Leslie
Current Estimated Value
Home Financials for this Owner
Home Financials are based on the most recent Mortgage that was taken out on this home.
Original Mortgage
$86,750
Outstanding Balance
$52,451
Interest Rate
6.15%
Mortgage Type
New Conventional
Estimated Equity
$113,638
Purchase Details
Closed on
Jul 15, 2005
Sold by
Stinchcomb Carl
Bought by
Hammond Matthew D and Hammond Brandi L
Home Financials for this Owner
Home Financials are based on the most recent Mortgage that was taken out on this home.
Original Mortgage
$80,400
Interest Rate
5.59%
Mortgage Type
FHA
Create a Home Valuation Report for This Property
The Home Valuation Report is an in-depth analysis detailing your home's value as well as a comparison with similar homes in the area
Home Values in the Area
Average Home Value in this Area
Purchase History
| Date | Buyer | Sale Price | Title Company |
|---|---|---|---|
| Graddick Leslie | $86,750 | -- | |
| Hammond Matthew D | $81,036 | -- |
Source: Public Records
Mortgage History
| Date | Status | Borrower | Loan Amount |
|---|---|---|---|
| Open | Graddick Leslie | $86,750 | |
| Previous Owner | Hammond Matthew D | $80,400 |
Source: Public Records
Tax History Compared to Growth
Tax History
| Year | Tax Paid | Tax Assessment Tax Assessment Total Assessment is a certain percentage of the fair market value that is determined by local assessors to be the total taxable value of land and additions on the property. | Land | Improvement |
|---|---|---|---|---|
| 2024 | $1,508 | $54,352 | $3,200 | $51,152 |
| 2023 | $1,508 | $52,438 | $3,200 | $49,238 |
| 2022 | $1,101 | $41,108 | $3,200 | $37,908 |
| 2021 | $979 | $35,852 | $3,200 | $32,652 |
| 2020 | $995 | $34,124 | $3,200 | $30,924 |
| 2019 | $956 | $31,568 | $3,200 | $28,368 |
| 2018 | $957 | $31,568 | $3,200 | $28,368 |
| 2017 | $981 | $29,480 | $3,200 | $26,280 |
| 2016 | $967 | $28,616 | $3,200 | $25,416 |
| 2015 | $959 | $28,616 | $3,200 | $25,416 |
| 2014 | $959 | $28,616 | $3,200 | $25,416 |
Source: Public Records
Map
Nearby Homes