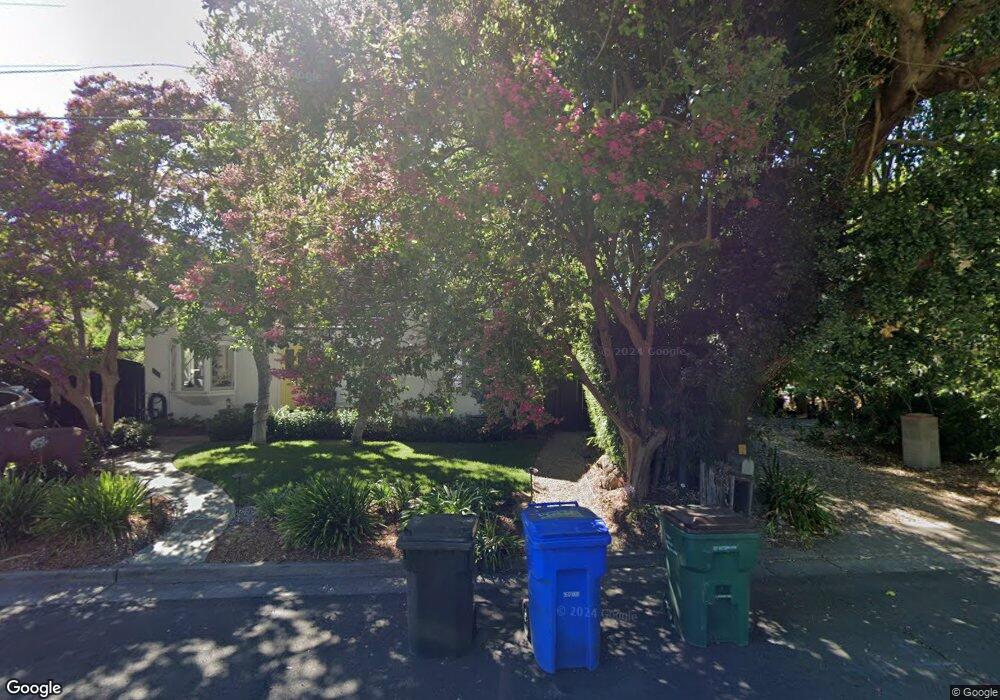
573 3rd St E Sonoma, CA 95476
Estimated Value: $603,946 - $1,398,000
2
Beds
1
Bath
708
Sq Ft
$1,543/Sq Ft
Est. Value
About This Home
This home is located at 573 3rd St E, Sonoma, CA 95476 and is currently estimated at $1,092,487, approximately $1,543 per square foot. 573 3rd St E is a home located in Sonoma County with nearby schools including Prestwood Elementary School, Adele Harrison Middle School, and Creekside High School.
Ownership History
Date
Name
Owned For
Owner Type
Purchase Details
Closed on
Mar 5, 1999
Sold by
Christensen Ted Jr 1993 Trust and Ronald A
Bought by
Sutro Ronald A
Current Estimated Value
Create a Home Valuation Report for This Property
The Home Valuation Report is an in-depth analysis detailing your home's value as well as a comparison with similar homes in the area
Home Values in the Area
Average Home Value in this Area
Purchase History
| Date | Buyer | Sale Price | Title Company |
|---|---|---|---|
| Sutro Ronald A | -- | -- |
Source: Public Records
Tax History
| Year | Tax Paid | Tax Assessment Tax Assessment Total Assessment is a certain percentage of the fair market value that is determined by local assessors to be the total taxable value of land and additions on the property. | Land | Improvement |
|---|---|---|---|---|
| 2025 | $4,162 | $258,658 | $235,152 | $23,506 |
| 2024 | $4,162 | $253,588 | $230,542 | $23,046 |
| 2023 | $4,162 | $248,617 | $226,022 | $22,595 |
| 2022 | $3,963 | $243,743 | $221,591 | $22,152 |
| 2021 | $3,862 | $238,965 | $217,247 | $21,718 |
| 2020 | $3,831 | $236,516 | $215,020 | $21,496 |
| 2019 | $3,744 | $231,879 | $210,804 | $21,075 |
| 2018 | $3,680 | $227,333 | $206,671 | $20,662 |
| 2017 | $4,391 | $222,876 | $202,619 | $20,257 |
| 2016 | $3,312 | $218,507 | $198,647 | $19,860 |
| 2015 | $3,269 | $215,226 | $195,664 | $19,562 |
| 2014 | $3,262 | $211,011 | $191,832 | $19,179 |
Source: Public Records
Map
Nearby Homes
Your Personal Tour Guide
Ask me questions while you tour the home.