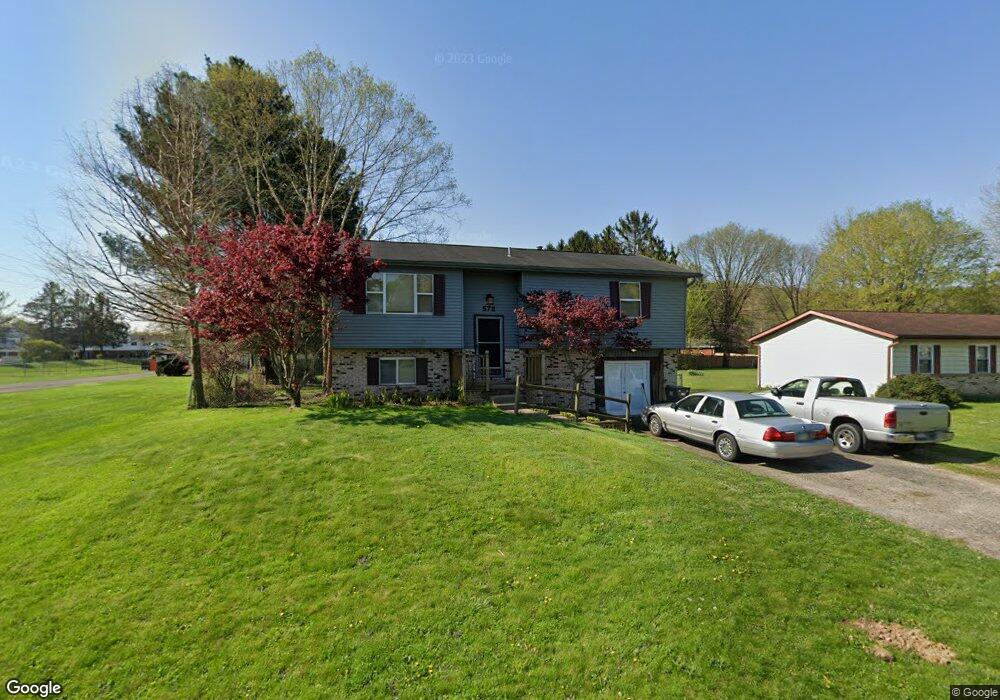
573 Derby Downs Rd Newark, OH 43055
Estimated Value: $164,000 - $311,000
3
Beds
2
Baths
1,828
Sq Ft
$137/Sq Ft
Est. Value
About This Home
This home is located at 573 Derby Downs Rd, Newark, OH 43055 and is currently estimated at $250,850, approximately $137 per square foot. 573 Derby Downs Rd is a home located in Licking County with nearby schools including Legend Elementary School, Liberty Middle School, and Newark High School.
Ownership History
Date
Name
Owned For
Owner Type
Purchase Details
Closed on
Feb 26, 2024
Sold by
Depalmo Gerald P
Bought by
Gpd Trust and Depalmo
Current Estimated Value
Purchase Details
Closed on
Jun 24, 2013
Sold by
Frcas Jeffrey Lee and Frcas Tina Marie
Bought by
Depalmo Gerald
Purchase Details
Closed on
Oct 20, 1999
Sold by
Mccort Mark
Bought by
Freas Jeffrey L and Freas Tina M
Home Financials for this Owner
Home Financials are based on the most recent Mortgage that was taken out on this home.
Original Mortgage
$92,755
Interest Rate
7.91%
Mortgage Type
FHA
Purchase Details
Closed on
Jul 1, 1996
Sold by
Green Randall A
Bought by
Mark and Mccort Michelle W
Home Financials for this Owner
Home Financials are based on the most recent Mortgage that was taken out on this home.
Original Mortgage
$70,400
Interest Rate
8.13%
Mortgage Type
New Conventional
Create a Home Valuation Report for This Property
The Home Valuation Report is an in-depth analysis detailing your home's value as well as a comparison with similar homes in the area
Home Values in the Area
Average Home Value in this Area
Purchase History
| Date | Buyer | Sale Price | Title Company |
|---|---|---|---|
| Gpd Trust | -- | None Listed On Document | |
| Depalmo Gerald | $66,000 | None Available | |
| Freas Jeffrey L | $93,500 | -- | |
| Mark | $88,000 | -- |
Source: Public Records
Mortgage History
| Date | Status | Borrower | Loan Amount |
|---|---|---|---|
| Previous Owner | Freas Jeffrey L | $92,755 | |
| Previous Owner | Mark | $70,400 |
Source: Public Records
Tax History
| Year | Tax Paid | Tax Assessment Tax Assessment Total Assessment is a certain percentage of the fair market value that is determined by local assessors to be the total taxable value of land and additions on the property. | Land | Improvement |
|---|---|---|---|---|
| 2025 | $2,520 | $66,960 | $22,470 | $44,490 |
| 2024 | $2,456 | $66,960 | $22,470 | $44,490 |
| 2023 | $2,452 | $66,960 | $22,470 | $44,490 |
| 2022 | $1,895 | $46,060 | $11,690 | $34,370 |
| 2021 | $1,988 | $46,060 | $11,690 | $34,370 |
| 2020 | $2,033 | $46,060 | $11,690 | $34,370 |
| 2019 | $1,726 | $37,630 | $9,000 | $28,630 |
| 2018 | $1,727 | $0 | $0 | $0 |
| 2017 | $1,873 | $0 | $0 | $0 |
| 2016 | $2,047 | $0 | $0 | $0 |
| 2015 | $2,091 | $0 | $0 | $0 |
| 2014 | $2,609 | $0 | $0 | $0 |
| 2013 | $1,436 | $0 | $0 | $0 |
Source: Public Records
Map
Nearby Homes
- 681 Woods Edge Ln
- 1501 Pheasant Run Dr
- 708 Olde Creek Dr
- 1521 W Quail Run Dr
- 521 Hemlock Place
- 0 Burch Dr NE
- 87 Brenton Dr
- 130 Gregory Dr
- 1954 Iselin St
- 1956 Jamesburg St
- 1972 Jamesburg St
- 1980 Jamesburg St
- 1821 Mount Vernon Rd
- 1381 Hillview Cir W Unit 1381
- 1964 Jamesburg St
- 1324 Hillview Cir W
- 1960 Jamesburg St
- 1984 Jamesburg St
- 1206 Hillview Cir E Unit 1206
- 98 Glenridge Dr
- 577 Derby Downs Rd
- 583 Derby Downs Rd
- 570 Derby Downs Rd
- 545 Derby Downs Rd
- 574 Derby Downs Rd
- 591 Derby Downs Rd
- 580 Derby Downs Rd
- 1754 King Rd
- 1780 King Rd
- 546 Derby Downs Rd
- 535 Derby Downs Rd
- 1788 King Rd
- 536 Derby Downs Rd
- 527 Derby Downs Rd
- 1796 King Rd
- 573 Essex Downs Rd
- 528 Derby Downs Rd
- 569 Essex Downs Rd
- 521 Derby Downs Rd
- 577 Essex Downs Rd
Your Personal Tour Guide
Ask me questions while you tour the home.