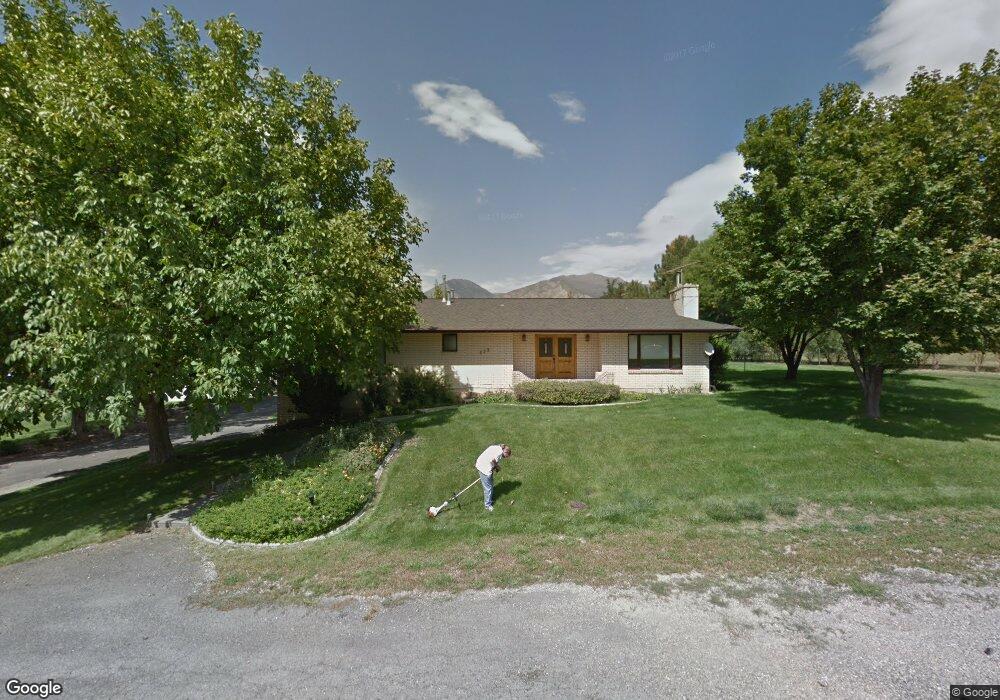
573 E 1100 S Mapleton, UT 84664
Estimated Value: $1,211,000 - $1,669,383
5
Beds
3
Baths
3,168
Sq Ft
$423/Sq Ft
Est. Value
About This Home
This home is located at 573 E 1100 S, Mapleton, UT 84664 and is currently estimated at $1,341,096, approximately $423 per square foot. 573 E 1100 S is a home located in Utah County with nearby schools including Mapleton School, Mapleton Junior High School, and Maple Mountain High School.
Ownership History
Date
Name
Owned For
Owner Type
Purchase Details
Closed on
Dec 19, 2013
Sold by
Erutinmo Llc
Bought by
Mapleton Lane Llc
Current Estimated Value
Purchase Details
Closed on
Nov 18, 2002
Sold by
Jensen Darrell E
Bought by
Jensen Darrell E and Jensen Debra L
Purchase Details
Closed on
Feb 19, 1998
Sold by
Jensen Darrel E and Jensen Debra L
Bought by
Jensen Darrell E and Jensen Debra L
Home Financials for this Owner
Home Financials are based on the most recent Mortgage that was taken out on this home.
Original Mortgage
$150,000
Interest Rate
6.97%
Purchase Details
Closed on
Oct 30, 1997
Sold by
Jones Ronald Lee and Jones Ruth Lee
Bought by
Jensen Darrel E and Jensen Debra L
Home Financials for this Owner
Home Financials are based on the most recent Mortgage that was taken out on this home.
Original Mortgage
$100,000
Interest Rate
7.36%
Create a Home Valuation Report for This Property
The Home Valuation Report is an in-depth analysis detailing your home's value as well as a comparison with similar homes in the area
Home Values in the Area
Average Home Value in this Area
Purchase History
| Date | Buyer | Sale Price | Title Company |
|---|---|---|---|
| Mapleton Lane Llc | -- | None Available | |
| Jensen Darrell E | -- | Access Title Company | |
| Jensen Darrell E | -- | Access Title Company | |
| Jensen Darrell E | -- | -- | |
| Jensen Darrel E | -- | -- |
Source: Public Records
Mortgage History
| Date | Status | Borrower | Loan Amount |
|---|---|---|---|
| Previous Owner | Jensen Darrell E | $150,000 | |
| Previous Owner | Jensen Darrel E | $100,000 |
Source: Public Records
Tax History
| Year | Tax Paid | Tax Assessment Tax Assessment Total Assessment is a certain percentage of the fair market value that is determined by local assessors to be the total taxable value of land and additions on the property. | Land | Improvement |
|---|---|---|---|---|
| 2025 | $6,902 | $676,890 | -- | -- |
| 2024 | $6,902 | $676,135 | $0 | $0 |
| 2023 | $7,095 | $699,400 | $0 | $0 |
| 2022 | $7,904 | $1,255,100 | $767,700 | $487,400 |
| 2021 | $6,021 | $803,900 | $429,000 | $374,900 |
| 2020 | $5,790 | $753,700 | $393,200 | $360,500 |
| 2019 | $5,287 | $696,700 | $383,200 | $313,500 |
| 2018 | $5,233 | $667,400 | $353,900 | $313,500 |
| 2017 | $4,984 | $372,035 | $0 | $0 |
| 2016 | $4,816 | $357,385 | $0 | $0 |
| 2015 | $4,386 | $323,505 | $0 | $0 |
| 2014 | $3,767 | $272,865 | $0 | $0 |
Source: Public Records
Map
Nearby Homes
- 748 Sierra View Dr
- 753 Sierra View Dr
- 2700 S Main St
- 644 S 1330 E
- 4021 S Ironwood Ln Unit 428
- 4886 S Englemann Ln Unit 525
- 2254 715 S Unit 60
- 4013 S Ironwood Ln Unit 432
- 4014 S Ironwood Ln
- 4001 S Ironwood Ln Unit 438
- 2254 715 S
- 4012 S Ironwood Ln Unit 424
- 2042 715 S Unit 57
- 4019 S Ironwood Ln Unit 429
- 2042 715 S
- 120 E Magnolia Place Unit 1
- 1974 S Preserve Dr Unit 56
- 1906 S Preserve Dr
- 1906 S Preserve Dr Unit 55
- 2057 E Maple Hills Ln
Your Personal Tour Guide
Ask me questions while you tour the home.