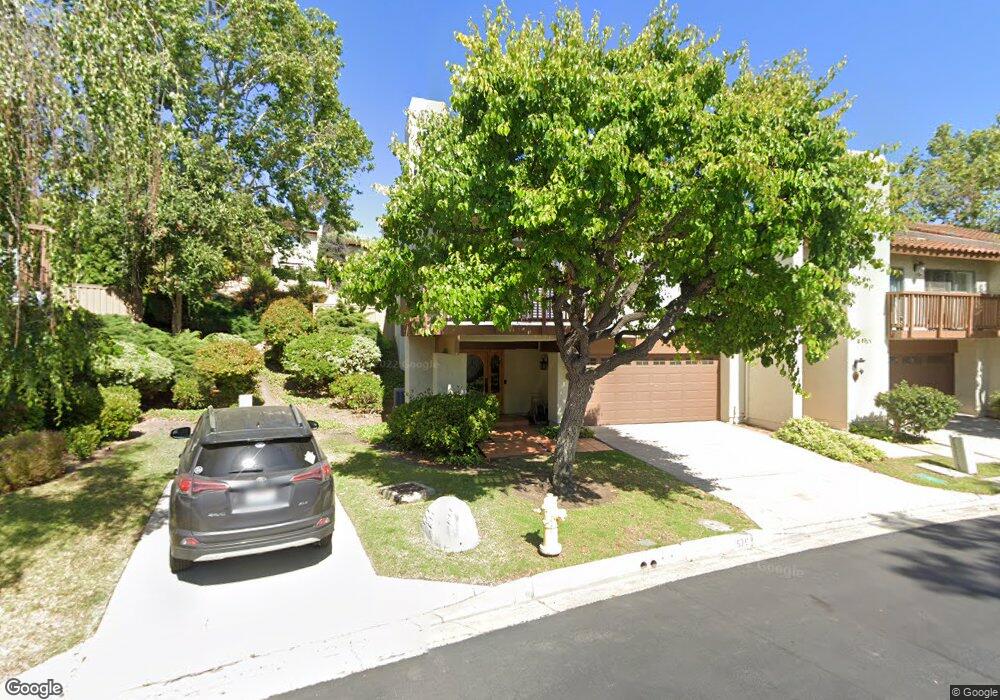
573 Hollyburne Ln Thousand Oaks, CA 91360
Estimated Value: $848,000 - $913,000
3
Beds
3
Baths
2,257
Sq Ft
$392/Sq Ft
Est. Value
About This Home
This home is located at 573 Hollyburne Ln, Thousand Oaks, CA 91360 and is currently estimated at $884,071, approximately $391 per square foot. 573 Hollyburne Ln is a home located in Ventura County with nearby schools including Acacia Elementary School, Redwood Middle School, and Thousand Oaks High School.
Ownership History
Date
Name
Owned For
Owner Type
Purchase Details
Closed on
Dec 19, 2006
Sold by
Amiri Nazanine
Bought by
Amiri Ramin
Current Estimated Value
Home Financials for this Owner
Home Financials are based on the most recent Mortgage that was taken out on this home.
Original Mortgage
$465,000
Outstanding Balance
$275,695
Interest Rate
6.16%
Mortgage Type
Negative Amortization
Estimated Equity
$608,376
Purchase Details
Closed on
Feb 17, 1998
Sold by
Phillips Kim D
Bought by
Kabir Ramin
Home Financials for this Owner
Home Financials are based on the most recent Mortgage that was taken out on this home.
Original Mortgage
$176,000
Interest Rate
7.02%
Create a Home Valuation Report for This Property
The Home Valuation Report is an in-depth analysis detailing your home's value as well as a comparison with similar homes in the area
Home Values in the Area
Average Home Value in this Area
Purchase History
| Date | Buyer | Sale Price | Title Company |
|---|---|---|---|
| Amiri Ramin | -- | Alliance Title Company | |
| Amiri Ramin | -- | Alliance Title Company | |
| Kabir Ramin | $211,000 | Investors Title Company |
Source: Public Records
Mortgage History
| Date | Status | Borrower | Loan Amount |
|---|---|---|---|
| Open | Amiri Ramin | $465,000 | |
| Closed | Kabir Ramin | $176,000 |
Source: Public Records
Tax History Compared to Growth
Tax History
| Year | Tax Paid | Tax Assessment Tax Assessment Total Assessment is a certain percentage of the fair market value that is determined by local assessors to be the total taxable value of land and additions on the property. | Land | Improvement |
|---|---|---|---|---|
| 2025 | $3,961 | $336,870 | $134,745 | $202,125 |
| 2024 | $3,961 | $330,265 | $132,103 | $198,162 |
| 2023 | $3,832 | $323,790 | $129,513 | $194,277 |
| 2022 | $3,762 | $317,442 | $126,974 | $190,468 |
| 2021 | $3,697 | $311,218 | $124,484 | $186,734 |
| 2020 | $3,295 | $308,028 | $123,208 | $184,820 |
| 2019 | $3,208 | $301,990 | $120,793 | $181,197 |
| 2018 | $3,145 | $296,070 | $118,425 | $177,645 |
| 2017 | $3,084 | $290,265 | $116,103 | $174,162 |
| 2016 | $3,056 | $284,575 | $113,827 | $170,748 |
| 2015 | $3,003 | $280,302 | $112,118 | $168,184 |
| 2014 | $2,961 | $274,814 | $109,923 | $164,891 |
Source: Public Records
Map
Nearby Homes
- 603 Racquet Club Ln
- 762 Tuolumne Ave
- 460 Arbor Lane Ct Unit 203
- 769 Birchpark Cir Unit 203
- 769 Birchpark Cir Unit 101
- 769 Birchpark Cir Unit 207
- 1202 Monte Sereno Dr
- 1229 Monte Sereno Dr
- 327 Chestnut Hill Ct Unit 22
- 788 Pinetree Cir Unit 13
- 324 Chestnut Hill Ct Unit 14
- 291 Sequoia Ct Unit 13
- 255 Sequoia Ct Unit 21
- 224 Oakleaf Dr Unit 105
- 224 Oakleaf Dr Unit 102
- 385 Somerset Cir
- 1449 Fordham Ave
- 428 Maidstone Ln
- 633 Camino Roberto
- 567 Hollyburne Ln
- 579 Hollyburne Ln
- 585 Hollyburne Ln
- 561 Hollyburne Ln
- 591 Hollyburne Ln
- 572 Hollyburne Ln
- 584 Hollyburne Ln
- 555 Hollyburne Ln
- 847 Woodlawn Dr
- 597 Hollyburne Ln
- 549 Hollyburne Ln
- 596 Hollyburne Ln
- 883 Woodlawn Dr
- 560 Hollyburne Ln
- 829 Woodlawn Dr
- 817 Woodlawn Dr
- 603 Hollyburne Ln
- 548 Hollyburne Ln
- 903 Woodlawn Dr
- 911 Woodlawn Dr