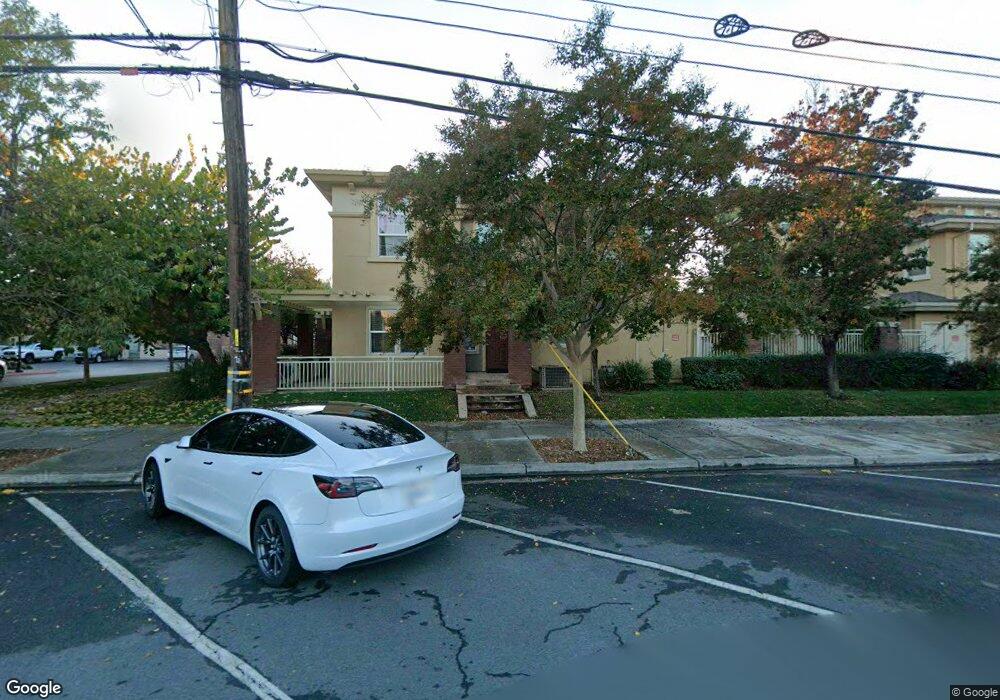
573 N 9th St Unit 12 San Jose, CA 95112
Japantown NeighborhoodEstimated Value: $809,000 - $957,000
2
Beds
3
Baths
1,380
Sq Ft
$622/Sq Ft
Est. Value
About This Home
This home is located at 573 N 9th St Unit 12, San Jose, CA 95112 and is currently estimated at $858,338, approximately $621 per square foot. 573 N 9th St Unit 12 is a home located in Santa Clara County with nearby schools including Grant Elementary School, Muwekma Ohlone Middle, and San Jose High School.
Ownership History
Date
Name
Owned For
Owner Type
Purchase Details
Closed on
Jun 8, 2009
Sold by
Horizon Tower Llc
Bought by
Ahn Jennifer and Nicholson John
Current Estimated Value
Purchase Details
Closed on
Nov 21, 2008
Sold by
Westerman David J
Bought by
Westerman David J
Home Financials for this Owner
Home Financials are based on the most recent Mortgage that was taken out on this home.
Original Mortgage
$112,000
Interest Rate
6.37%
Mortgage Type
Credit Line Revolving
Purchase Details
Closed on
Sep 11, 2003
Sold by
Westerman Sheri Rene
Bought by
Westerman David J
Home Financials for this Owner
Home Financials are based on the most recent Mortgage that was taken out on this home.
Original Mortgage
$365,972
Interest Rate
5.5%
Mortgage Type
Purchase Money Mortgage
Create a Home Valuation Report for This Property
The Home Valuation Report is an in-depth analysis detailing your home's value as well as a comparison with similar homes in the area
Home Values in the Area
Average Home Value in this Area
Purchase History
| Date | Buyer | Sale Price | Title Company |
|---|---|---|---|
| Ahn Jennifer | $2,000 | Chicago Title Company | |
| Westerman David J | -- | Chicago Title Company | |
| Westerman David J | -- | Chicago Title | |
| Westerman David J | $457,500 | Chicago Title |
Source: Public Records
Mortgage History
| Date | Status | Borrower | Loan Amount |
|---|---|---|---|
| Previous Owner | Westerman David J | $112,000 | |
| Previous Owner | Westerman David J | $365,972 |
Source: Public Records
Tax History Compared to Growth
Tax History
| Year | Tax Paid | Tax Assessment Tax Assessment Total Assessment is a certain percentage of the fair market value that is determined by local assessors to be the total taxable value of land and additions on the property. | Land | Improvement |
|---|---|---|---|---|
| 2025 | $2,424 | $116,375 | $24,454 | $91,921 |
| 2024 | $2,424 | $114,094 | $23,975 | $90,119 |
| 2023 | $2,346 | $111,857 | $23,505 | $88,352 |
| 2022 | $2,325 | $109,665 | $23,045 | $86,620 |
| 2021 | $2,231 | $107,516 | $22,594 | $84,922 |
| 2020 | $2,231 | $106,415 | $22,363 | $84,052 |
| 2019 | $2,158 | $104,329 | $21,925 | $82,404 |
| 2018 | $2,116 | $102,285 | $21,496 | $80,789 |
| 2017 | $2,086 | $100,280 | $21,075 | $79,205 |
| 2016 | $1,959 | $98,314 | $20,662 | $77,652 |
| 2015 | $1,936 | $96,838 | $20,352 | $76,486 |
| 2014 | $1,482 | $94,942 | $19,954 | $74,988 |
Source: Public Records
Map
Nearby Homes
- 448 Jackson St
- 509 N 9th St Unit 23
- 534 N 7th St
- 1020 N 5th St
- 748-3 N 10th St
- 350 E Mission St Unit 211
- 350 E Mission St Unit 115
- 421 N 13th St
- 358 N 7th St
- 800 N 8th St Unit 120
- 800 N 8th St Unit 311
- 800 N 8th St Unit 207
- 775 N 14th St
- 689 N 16th St
- 286 N 9th St
- 647 N 2nd St
- 818 N 13th St
- 447 N 2nd St
- 301 N 5th St
- 0 George Blvd Unit HD22141315
- 569 N 9th St
- 565 N 9th St
- 577 N 9th St Unit 9
- 581 N 9th St
- 585 N 9th St
- 549 N 9th St
- 553 N 9th St Unit 14
- 557 N 9th St
- 593 N 9th St Unit 161
- 589 N 9th St Unit 162
- 597 N 9th St Unit 160
- 574 Manzana Place Unit 69
- 572 Manzana Place
- 570 Manzana Place
- 568 Manzana Place Unit 66
- 566 Manzana Place
- 564 Manzana Place Unit 64
- 562 Manzana Place
- 560 Manzana Place Unit 62
- 558 Manzana Place