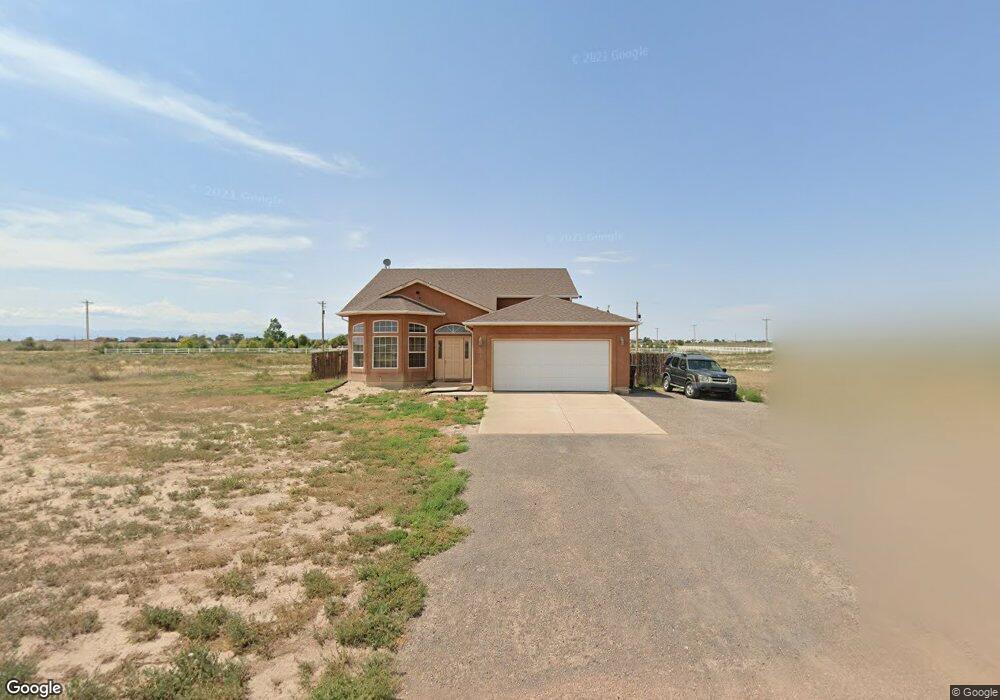
573 N Limon Dr Pueblo, CO 81007
Estimated Value: $370,890 - $429,000
1
Bed
3
Baths
1,365
Sq Ft
$296/Sq Ft
Est. Value
About This Home
This home is located at 573 N Limon Dr, Pueblo, CO 81007 and is currently estimated at $403,973, approximately $295 per square foot. 573 N Limon Dr is a home located in Pueblo County with nearby schools including Prairie Winds Elementary School, Liberty Point International School, and Pueblo West High School.
Ownership History
Date
Name
Owned For
Owner Type
Purchase Details
Closed on
Aug 1, 2017
Sold by
Weathers Laurie A
Bought by
Weathers Scott
Current Estimated Value
Home Financials for this Owner
Home Financials are based on the most recent Mortgage that was taken out on this home.
Original Mortgage
$156,000
Outstanding Balance
$129,959
Interest Rate
3.9%
Mortgage Type
New Conventional
Estimated Equity
$274,014
Purchase Details
Closed on
Oct 29, 2010
Sold by
Family Home & Building Corporation
Bought by
Weathers Laurie A
Home Financials for this Owner
Home Financials are based on the most recent Mortgage that was taken out on this home.
Original Mortgage
$164,314
Interest Rate
4.41%
Mortgage Type
FHA
Purchase Details
Closed on
Jun 9, 2010
Sold by
Meyers Debbie J
Bought by
Kin Ran
Purchase Details
Closed on
Nov 7, 2008
Sold by
Meyers Robert
Bought by
Meyers Debbie J
Create a Home Valuation Report for This Property
The Home Valuation Report is an in-depth analysis detailing your home's value as well as a comparison with similar homes in the area
Home Values in the Area
Average Home Value in this Area
Purchase History
| Date | Buyer | Sale Price | Title Company |
|---|---|---|---|
| Weathers Scott | $195,000 | Stewart Title | |
| Weathers Laurie A | $193,360 | Fidelity National Title Insu | |
| Kin Ran | $10,000 | Stewart Title | |
| Meyers Debbie J | -- | None Available |
Source: Public Records
Mortgage History
| Date | Status | Borrower | Loan Amount |
|---|---|---|---|
| Open | Weathers Scott | $156,000 | |
| Previous Owner | Weathers Laurie A | $164,314 |
Source: Public Records
Tax History Compared to Growth
Tax History
| Year | Tax Paid | Tax Assessment Tax Assessment Total Assessment is a certain percentage of the fair market value that is determined by local assessors to be the total taxable value of land and additions on the property. | Land | Improvement |
|---|---|---|---|---|
| 2024 | $2,311 | $23,030 | -- | -- |
| 2023 | $2,337 | $26,710 | $3,580 | $23,130 |
| 2022 | $1,965 | $19,582 | $2,330 | $17,252 |
| 2021 | $2,015 | $20,150 | $2,400 | $17,750 |
| 2020 | $1,792 | $20,150 | $2,400 | $17,750 |
| 2019 | $1,786 | $17,873 | $715 | $17,158 |
| 2018 | $1,572 | $15,720 | $540 | $15,180 |
| 2017 | $1,574 | $15,720 | $540 | $15,180 |
| 2016 | $1,480 | $14,809 | $637 | $14,172 |
| 2015 | $1,468 | $14,809 | $637 | $14,172 |
| 2014 | $1,351 | $13,623 | $756 | $12,867 |
Source: Public Records
Map
Nearby Homes
- 613 N Limon Dr
- 694 N Limon Dr
- 678 N Limon Dr
- 678 N Limon Dr Unit 7
- 686 N Limon Dr
- 584 Winona Dr
- 1673 Silverwood Dr
- 679 Mint Dr
- 634 N Boyero Ave
- 1437 E Escondido Dr
- 392 N Heather Dr
- 1485 E Ithaca Dr
- 691 N Mint Dr
- 1727 Mint Cir
- 1427 E Kiva Dr
- 535 N Boyero Ave
- 1760 E Mint Cir
- 1394 E Kiva Dr
- 577 & 571 N Boyero Ave
- 1776 E Mint Cir
- 573 N Limon Dr Unit 4
- 1613 E Platteville Blvd
- 1613 E Platteville Blvd Unit 3
- 561 N Limon Dr
- 585 N Limon Dr Unit 5
- 585 N Limon Dr
- 1605 E Platteville Blvd
- 574 N Limon Dr
- 586 N Limon Dr Unit 11
- 598 N Limon Ct
- 598 N Limon Ct Unit 10
- 598 N Limon Ct
- 574 N Limon Ct Unit 12
- 610 N Limon Ct Unit 9
- 613 N Limon Ct Unit 9
- 605 N Limon Dr Unit 8
- 1637 E Platteville Blvd Unit 15
- 608 N Limon Dr
- 645 N Limon Ct
- 645 N Limon Ct Unit 3