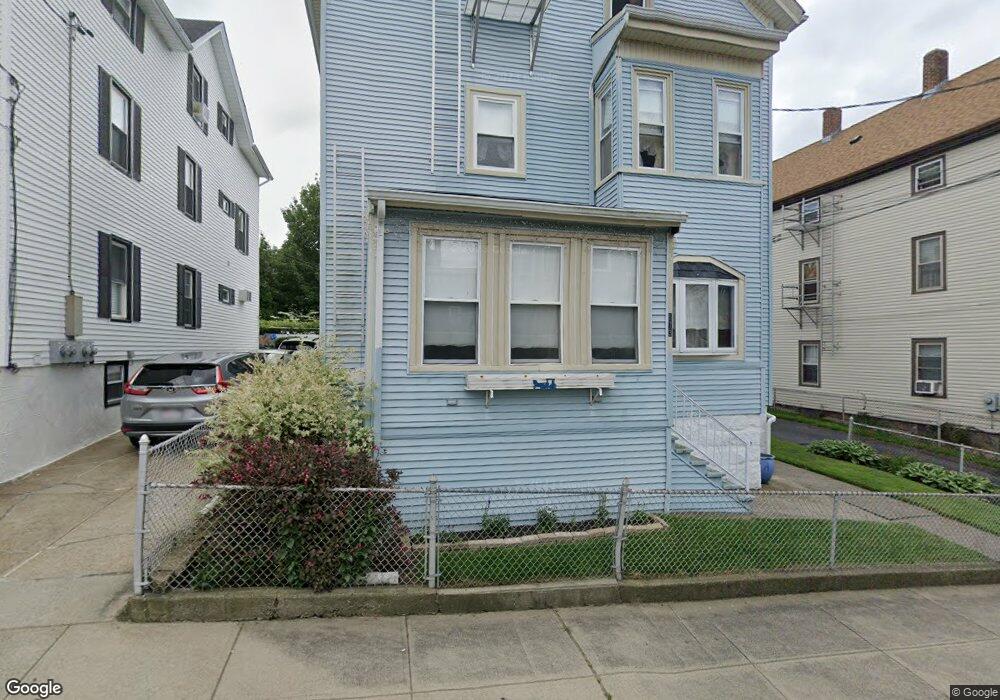
573 Osborn St Fall River, MA 02724
Father Kelly NeighborhoodEstimated Value: $546,724 - $676,000
9
Beds
3
Baths
3,357
Sq Ft
$185/Sq Ft
Est. Value
About This Home
This home is located at 573 Osborn St, Fall River, MA 02724 and is currently estimated at $619,681, approximately $184 per square foot. 573 Osborn St is a home located in Bristol County with nearby schools including Henry Lord Community School, B M C Durfee High School, and Argosy Collegiate Charter School.
Ownership History
Date
Name
Owned For
Owner Type
Purchase Details
Closed on
Nov 23, 1998
Sold by
Maciel Andrew and Maciel Sandra J
Bought by
Maciel Debra A
Current Estimated Value
Home Financials for this Owner
Home Financials are based on the most recent Mortgage that was taken out on this home.
Original Mortgage
$90,000
Interest Rate
6.49%
Mortgage Type
Purchase Money Mortgage
Purchase Details
Closed on
Jan 18, 1990
Sold by
Fagan Linda G
Bought by
Maciel Andrew
Home Financials for this Owner
Home Financials are based on the most recent Mortgage that was taken out on this home.
Original Mortgage
$180,000
Interest Rate
9.68%
Mortgage Type
Purchase Money Mortgage
Create a Home Valuation Report for This Property
The Home Valuation Report is an in-depth analysis detailing your home's value as well as a comparison with similar homes in the area
Home Values in the Area
Average Home Value in this Area
Purchase History
| Date | Buyer | Sale Price | Title Company |
|---|---|---|---|
| Maciel Debra A | $130,000 | -- | |
| Maciel Andrew | $130,000 | -- |
Source: Public Records
Mortgage History
| Date | Status | Borrower | Loan Amount |
|---|---|---|---|
| Closed | Maciel Andrew | $20,000 | |
| Open | Maciel Andrew | $105,000 | |
| Closed | Maciel Andrew | $90,000 | |
| Previous Owner | Maciel Andrew | $180,000 |
Source: Public Records
Tax History
| Year | Tax Paid | Tax Assessment Tax Assessment Total Assessment is a certain percentage of the fair market value that is determined by local assessors to be the total taxable value of land and additions on the property. | Land | Improvement |
|---|---|---|---|---|
| 2025 | $5,877 | $513,300 | $108,100 | $405,200 |
| 2024 | $5,630 | $490,000 | $104,100 | $385,900 |
| 2023 | $4,998 | $407,300 | $86,000 | $321,300 |
| 2022 | $4,269 | $354,400 | $81,900 | $272,500 |
| 2021 | $4,269 | $308,700 | $77,900 | $230,800 |
| 2020 | $3,862 | $267,300 | $76,800 | $190,500 |
| 2019 | $3,340 | $229,100 | $74,000 | $155,100 |
| 2018 | $3,232 | $221,100 | $80,100 | $141,000 |
| 2017 | $3,042 | $217,300 | $76,300 | $141,000 |
| 2016 | $2,986 | $219,100 | $81,200 | $137,900 |
| 2015 | $2,867 | $219,200 | $81,200 | $138,000 |
| 2014 | $2,873 | $228,400 | $78,800 | $149,600 |
Source: Public Records
Map
Nearby Homes
- 563 Osborn St
- 563 Osborn St Unit 1
- 581 Osborn St
- 559 Osborn St
- 68 Manton St
- 549 Osborn St
- 566 Osborn St
- 566 Osborn St Unit 3
- 556 Osborn St
- 556-560 Oborn St
- 875 2nd St
- 578 Osborn St
- 58 Manton St
- 82 Manton St Unit 1E
- 857 Second St Unit 3
- 46 Manton St
- 887 2nd St
- 857 2nd St
- 857 2nd St Unit 1
- 857 2nd St Unit 2
Your Personal Tour Guide
Ask me questions while you tour the home.