573 S Highland Ave Columbus, OH 43223
South Central Hilltop NeighborhoodEstimated payment $774/month
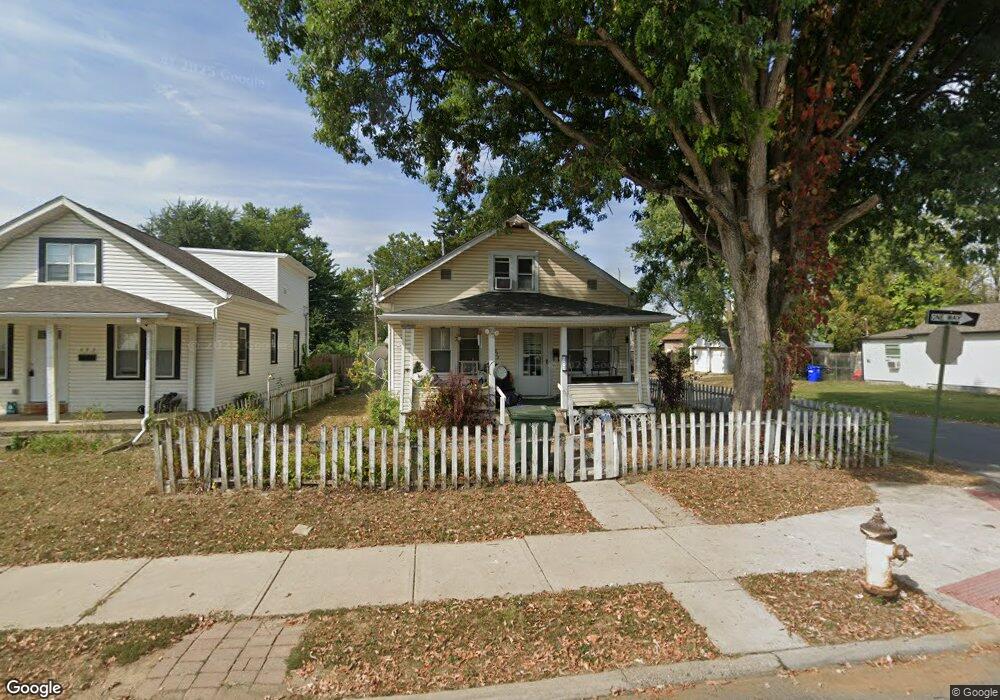
Highlights
- Cape Cod Architecture
- Wood Flooring
- 1 Car Detached Garage
- Deck
- No HOA
- Shed
About This Home
Nice little cape cod style home on a corner lot in the Hilltop. Changes to the area are becoming more evident as homes are being gentrified. This house is part of an estate and is being sold to settle the same. SOLD IN AS-IS CONDITION. Will make a good first time home owner or flip.
Home Details
Home Type
- Single Family
Est. Annual Taxes
- $1,081
Year Built
- Built in 1925
Parking
- 1 Car Detached Garage
Home Design
- Cape Cod Architecture
- Block Foundation
- Vinyl Siding
Interior Spaces
- 1,319 Sq Ft Home
- 1-Story Property
- Insulated Windows
- Wood Flooring
- Partial Basement
Bedrooms and Bathrooms
- 1 Full Bathroom
Outdoor Features
- Deck
- Shed
Additional Features
- 4,356 Sq Ft Lot
- Forced Air Heating and Cooling System
Community Details
- No Home Owners Association
Listing and Financial Details
- Assessor Parcel Number 010-065906
Map
Home Values in the Area
Average Home Value in this Area
Tax History
| Year | Tax Paid | Tax Assessment Tax Assessment Total Assessment is a certain percentage of the fair market value that is determined by local assessors to be the total taxable value of land and additions on the property. | Land | Improvement |
|---|---|---|---|---|
| 2025 | $1,081 | $33,890 | $5,220 | $28,670 |
| 2024 | $1,081 | $33,890 | $5,220 | $28,670 |
| 2023 | $1,095 | $33,880 | $5,215 | $28,665 |
| 2022 | $311 | $14,740 | $1,890 | $12,850 |
| 2021 | $311 | $14,740 | $1,890 | $12,850 |
| 2020 | $312 | $14,740 | $1,890 | $12,850 |
| 2019 | $215 | $12,290 | $1,580 | $10,710 |
| 2018 | $107 | $12,290 | $1,580 | $10,710 |
| 2017 | $215 | $12,290 | $1,580 | $10,710 |
| 2016 | $63 | $9,700 | $3,260 | $6,440 |
| 2015 | $29 | $9,700 | $3,260 | $6,440 |
| 2014 | $57 | $9,700 | $3,260 | $6,440 |
| 2013 | $78 | $11,375 | $3,815 | $7,560 |
Purchase History
| Date | Type | Sale Price | Title Company |
|---|---|---|---|
| Special Warranty Deed | $7,000 | Accutitle Agency Inc | |
| Sheriffs Deed | $30,000 | None Available | |
| Deed | $35,900 | -- |
Source: Columbus and Central Ohio Regional MLS
MLS Number: 226008709
APN: 010-065906
Disclaimer: Certain information contained herein is derived from information provided by parties other than Homes.com. All information provided is deemed reliable, but is not guaranteed to be accurate and should be independently verified.
![]() IDX information is provided exclusively for personal, non-commercial use, and may not be used for any purpose other than to identify prospective properties consumers may be interested in purchasing.
IDX information is provided exclusively for personal, non-commercial use, and may not be used for any purpose other than to identify prospective properties consumers may be interested in purchasing.
Information is deemed reliable but not guaranteed.
- 545-547 S Highland Ave Unit 545
- 538 S Wheatland Ave
- 558 S Oakley Ave Unit 60
- 629 S Wheatland Ave Unit 631
- 637 S Wheatland Ave Unit 639
- 542 S Oakley Ave
- 2247 Safford Ave
- 2397 Sullivant Ave
- 2182 Homewood Ave
- 511 S Wayne Ave
- 530 Whitethorne Ave
- 485 Belvidere Ave
- 426 S Eureka Ave
- 561 Belvidere Ave
- 651 S Terrace Ave
- 346 S Wheatland Ave
- 341 S Wheatland Ave
- 510 Belvidere Ave
- 461 S Terrace Ave
- 302 S Highland Ave Unit 306
- 2171 Amherst Ave
- 745 S Wayne Ave
- 367 S Wayne Ave
- 661 S Burgess Ave
- 475 S Ogden Ave
- 947 Forest Creek Dr E
- 218 Lechner Ave
- 436 Larcomb Ave
- 2350 Appleridge Dr
- 281 S Powell Ave
- 162 S Powell Ave Unit B
- 83 S Powell Ave Unit 83 S Powell Ave
- 372-374-374 S Huron Ave Unit 372
- 800 Harrisburg Pike Unit 2 bedroom townhomes
- 800 Harrisburg Pike Unit 1 bedroom
- 1281 Harpers Grove Ct
- 2432 Steele Ave
- 67 N Harris Ave
- 1023 Chestershire Rd
- 196 N Burgess Ave

Ask me questions while you tour the home.