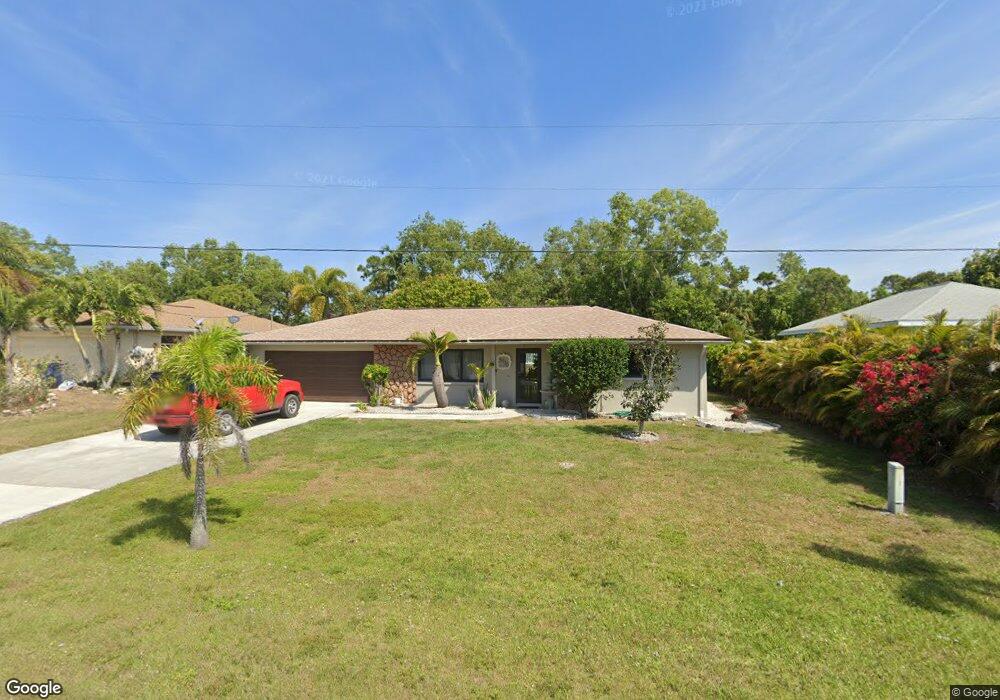
5730 Linden Ln Bokeelia, FL 33922
Estimated Value: $296,986 - $425,000
3
Beds
2
Baths
1,686
Sq Ft
$216/Sq Ft
Est. Value
About This Home
This home is located at 5730 Linden Ln, Bokeelia, FL 33922 and is currently estimated at $364,997, approximately $216 per square foot. 5730 Linden Ln is a home located in Lee County with nearby schools including Pine Island Elementary School, Trafalgar Middle School, and Gulf Middle School.
Ownership History
Date
Name
Owned For
Owner Type
Purchase Details
Closed on
Feb 15, 2008
Sold by
Ordonez Jorge Oscar and Suarez Angela Maria
Bought by
Suarez Angela Maria
Current Estimated Value
Purchase Details
Closed on
Jul 29, 2005
Sold by
Bollen David M and Bollen Amy E
Bought by
Ordonez Jorge and Suarez Angela
Home Financials for this Owner
Home Financials are based on the most recent Mortgage that was taken out on this home.
Original Mortgage
$222,400
Outstanding Balance
$109,814
Interest Rate
4.83%
Mortgage Type
Negative Amortization
Estimated Equity
$255,183
Purchase Details
Closed on
Feb 2, 2005
Sold by
Epperson John V and Epperson Alice M
Bought by
Bollen David M and Bollen Amy E
Purchase Details
Closed on
Oct 12, 2001
Sold by
Allender Robert J and Allender Vicki Lynn
Bought by
Epperson John V and Epperson Alice M
Create a Home Valuation Report for This Property
The Home Valuation Report is an in-depth analysis detailing your home's value as well as a comparison with similar homes in the area
Home Values in the Area
Average Home Value in this Area
Purchase History
| Date | Buyer | Sale Price | Title Company |
|---|---|---|---|
| Suarez Angela Maria | -- | None Available | |
| Ordonez Jorge | $278,000 | -- | |
| Bollen David M | $230,000 | -- | |
| Epperson John V | $119,000 | -- |
Source: Public Records
Mortgage History
| Date | Status | Borrower | Loan Amount |
|---|---|---|---|
| Open | Ordonez Jorge | $222,400 |
Source: Public Records
Tax History Compared to Growth
Tax History
| Year | Tax Paid | Tax Assessment Tax Assessment Total Assessment is a certain percentage of the fair market value that is determined by local assessors to be the total taxable value of land and additions on the property. | Land | Improvement |
|---|---|---|---|---|
| 2025 | $3,379 | $218,462 | $47,060 | $156,255 |
| 2024 | $3,865 | $207,402 | $31,938 | $160,384 |
| 2023 | $3,865 | $208,349 | $0 | $0 |
| 2022 | $3,218 | $178,533 | $0 | $0 |
| 2021 | $2,773 | $162,303 | $25,300 | $137,003 |
| 2020 | $2,607 | $150,203 | $25,300 | $124,903 |
| 2019 | $2,604 | $147,774 | $26,900 | $120,874 |
| 2018 | $2,619 | $146,166 | $21,500 | $124,666 |
| 2017 | $2,614 | $142,928 | $20,900 | $122,028 |
| 2016 | $2,422 | $129,620 | $20,900 | $108,720 |
| 2015 | $2,251 | $122,397 | $20,900 | $101,497 |
| 2014 | $2,169 | $117,493 | $19,000 | $98,493 |
| 2013 | -- | $115,907 | $20,000 | $95,907 |
Source: Public Records
Map
Nearby Homes
- 5725 Genesee Pkwy Unit 10
- 5643 Ann Arbor Dr
- 11397 Argentine Ct
- 11638 Oakland Dr
- 11406 Argentine Ct
- 5561 Blyth Ct
- 11219 Stringfellow Rd
- 5260 Genesee Pkwy
- 5175 Genesee Pkwy
- 5911 Eastling Dr
- 5520 Rainbow Dr
- 5529 Rainbow Dr
- 5578 Easy St
- 5718 Judith Rd
- 5547 Ann Arbor Dr
- 5620 Ann Arbor Dr
- 5675, 5659, &5643 Ann Arbor Dr
- 5496 Ann Arbor Dr
- 5476 Easy St
- 5558 Easy St
- 5748 Linden Ln Unit 50
- 5748 Linden Ln
- 5781 Linden Ln
- 5712 Linden Ln
- 5766 Linden Ln
- 5739 Linden Ln
- 5711 Linden Ln
- 11463 Oakland Dr
- 11480 Stringfellow Rd
- 11488 Oakland Dr
- 5724 Genesee Pkwy
- 11408 Oakland Dr
- 5766 Genesee Pkwy
- 5712 Genesee Pkwy
- 11390 Oakland Dr
- 11499 Oakland Dr
- 5803 Linden Ln
- 5820 Linden Ln
- 5674 Saint Marie Ln
- 11443 Flint Ln