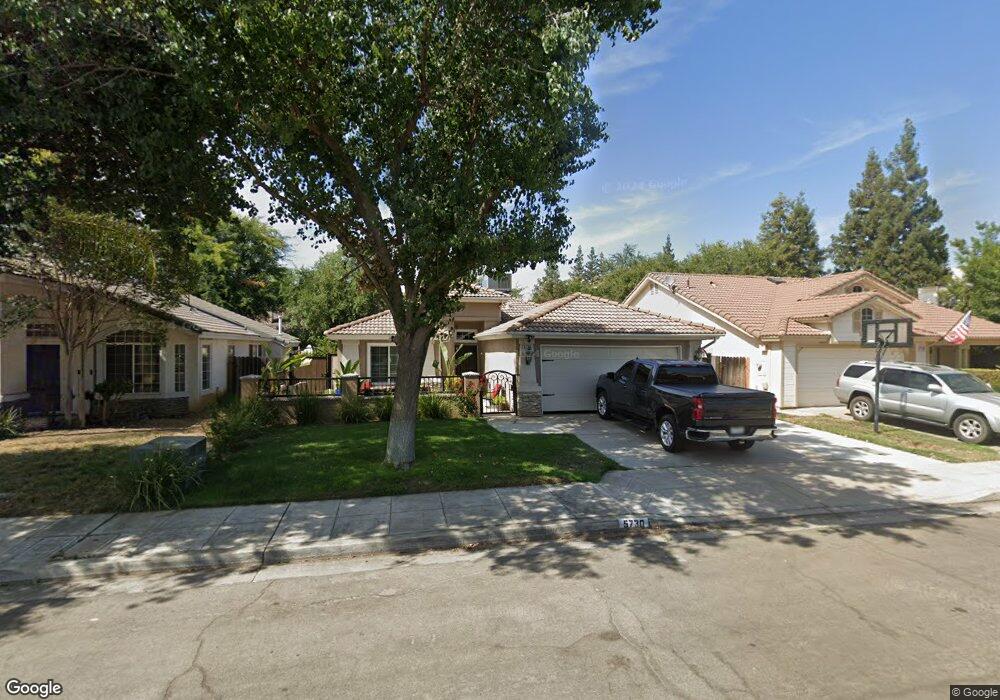
5730 W Parr Ave Fresno, CA 93722
Sierra Sky Park NeighborhoodEstimated Value: $371,570 - $446,000
3
Beds
2
Baths
1,304
Sq Ft
$302/Sq Ft
Est. Value
About This Home
This home is located at 5730 W Parr Ave, Fresno, CA 93722 and is currently estimated at $393,393, approximately $301 per square foot. 5730 W Parr Ave is a home located in Fresno County with nearby schools including River Bluff Elementary School and Rio Vista Middle School.
Ownership History
Date
Name
Owned For
Owner Type
Purchase Details
Closed on
Jul 26, 2011
Sold by
Bac Home Loans Servicing Lp
Bought by
Perez Arturo and Perez Ana I
Current Estimated Value
Purchase Details
Closed on
May 4, 2011
Sold by
Lozano Sergio and Lozano Angelica
Bought by
Bac Home Loans Servicing Lp and Countrywide Home Loans Servicing Lp
Purchase Details
Closed on
Apr 12, 2005
Sold by
Locicero Frank
Bought by
Lozano Sergio and Lozano Angelica
Home Financials for this Owner
Home Financials are based on the most recent Mortgage that was taken out on this home.
Original Mortgage
$218,000
Interest Rate
1.37%
Mortgage Type
Negative Amortization
Purchase Details
Closed on
Apr 15, 1996
Sold by
Mccaffrey Development Lp
Bought by
Locicero Frank
Home Financials for this Owner
Home Financials are based on the most recent Mortgage that was taken out on this home.
Original Mortgage
$96,012
Interest Rate
7.41%
Mortgage Type
FHA
Create a Home Valuation Report for This Property
The Home Valuation Report is an in-depth analysis detailing your home's value as well as a comparison with similar homes in the area
Home Values in the Area
Average Home Value in this Area
Purchase History
| Date | Buyer | Sale Price | Title Company |
|---|---|---|---|
| Perez Arturo | $123,500 | North America Title Co Inc | |
| Bac Home Loans Servicing Lp | $135,900 | None Available | |
| Lozano Sergio | $272,500 | Chicago Title Company | |
| Locicero Frank | $97,000 | Stewart Title |
Source: Public Records
Mortgage History
| Date | Status | Borrower | Loan Amount |
|---|---|---|---|
| Previous Owner | Lozano Sergio | $218,000 | |
| Previous Owner | Locicero Frank | $96,012 |
Source: Public Records
Tax History Compared to Growth
Tax History
| Year | Tax Paid | Tax Assessment Tax Assessment Total Assessment is a certain percentage of the fair market value that is determined by local assessors to be the total taxable value of land and additions on the property. | Land | Improvement |
|---|---|---|---|---|
| 2025 | $1,965 | $155,114 | $56,518 | $98,596 |
| 2023 | $1,918 | $149,092 | $54,324 | $94,768 |
| 2022 | $1,810 | $146,169 | $53,259 | $92,910 |
| 2021 | $1,824 | $143,304 | $52,215 | $91,089 |
| 2020 | $1,735 | $141,835 | $51,680 | $90,155 |
| 2019 | $1,709 | $139,055 | $50,667 | $88,388 |
| 2018 | $1,669 | $136,329 | $49,674 | $86,655 |
| 2017 | $1,675 | $133,656 | $48,700 | $84,956 |
| 2016 | $1,544 | $131,037 | $47,746 | $83,291 |
| 2015 | $1,537 | $129,069 | $47,029 | $82,040 |
| 2014 | $1,537 | $126,541 | $46,108 | $80,433 |
Source: Public Records
Map
Nearby Homes
- 5802 W Millbrae Ave
- 5838 W Fallon Ave
- 7195 N Carnegie Ave
- 6675 N Lola Ave
- 5989 W Turtle Bay Dr
- 5804 W Chennault Ave
- 5908 W Fremont Ave
- 6536 N Wheeler Ave
- 5807 W Paul Ave
- 7005 N Astoria Dr
- 6001 W Alluvial Ave
- 6583 N State Ave
- 6671 N Sandrini Ave
- 6203 W Chennault Ave
- 5753 W Ellery Ave
- 5811 W Cromwell Ave
- 6075 W Menlo Ave
- 7568 N Hanna Ave
- 5049 W Locust Ave
- 7526 N Ellendale Ave
- 5720 W Parr Ave
- 5740 W Parr Ave
- 5710 W Parr Ave
- 5725 W Beechwood Ave
- 5750 W Parr Ave
- 5735 W Beechwood Ave
- 5715 W Beechwood Ave
- 5725 W Parr Ave
- 5745 W Beechwood Ave
- 5737 W Parr Ave
- 5690 W Parr Ave
- 5749 W Parr Ave
- 5713 W Parr Ave
- 5691 W Beechwood Ave
- 5761 W Parr Ave
- 5680 W Parr Ave
- 5701 W Parr Ave
- 5681 W Beechwood Ave
- 5689 W Parr Ave
- 7009 N Carnegie Ave