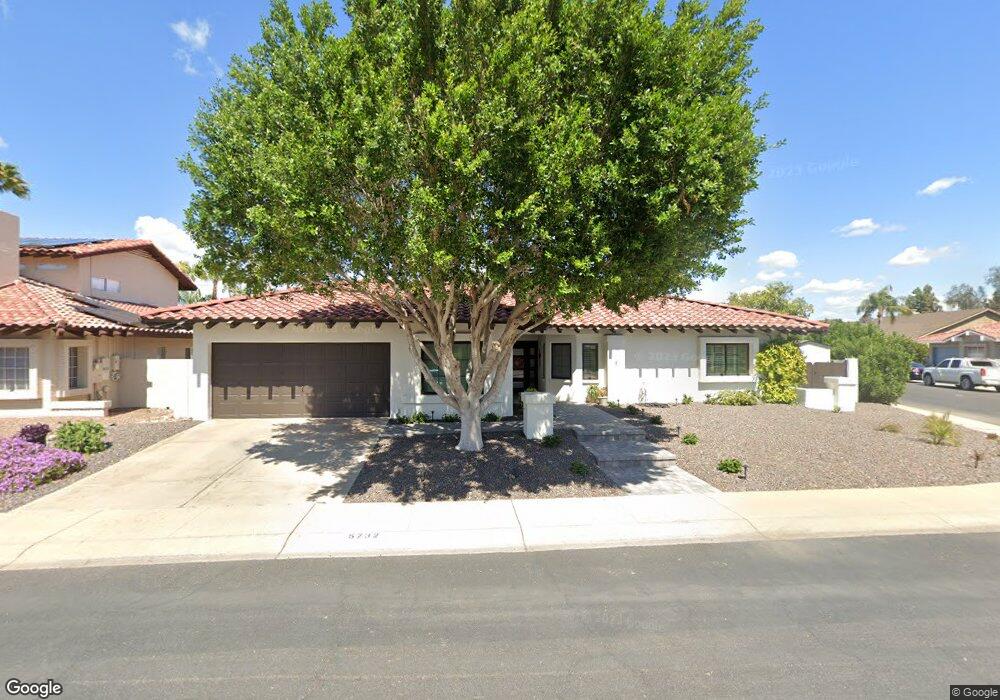
5732 E Claire Dr Scottsdale, AZ 85254
Paradise Valley Village NeighborhoodEstimated Value: $760,790 - $1,202,000
--
Bed
2
Baths
2,216
Sq Ft
$448/Sq Ft
Est. Value
About This Home
This home is located at 5732 E Claire Dr, Scottsdale, AZ 85254 and is currently estimated at $992,198, approximately $447 per square foot. 5732 E Claire Dr is a home located in Maricopa County with nearby schools including Desert Springs Preparatory Elementary School, Liberty Elementary School, and Desert Shadows Middle School.
Ownership History
Date
Name
Owned For
Owner Type
Purchase Details
Closed on
Dec 18, 2017
Sold by
Rairdan Brian D and Rairdan Sandra D
Bought by
Rairdan Brian D and Rairdan Sandra D
Current Estimated Value
Purchase Details
Closed on
Nov 8, 2000
Sold by
Corbin Carol G
Bought by
Rairdan Brian D and Rairdan Sandra D
Home Financials for this Owner
Home Financials are based on the most recent Mortgage that was taken out on this home.
Original Mortgage
$105,000
Interest Rate
7.82%
Mortgage Type
New Conventional
Purchase Details
Closed on
Sep 8, 1997
Sold by
Kane William James and Kane Zena Lorraine
Bought by
Corbin Carol G
Purchase Details
Closed on
Oct 28, 1996
Sold by
Pinkava Gary M and Pinkava Cynthia A
Bought by
Kane William James and Kane Zena Lorraine
Home Financials for this Owner
Home Financials are based on the most recent Mortgage that was taken out on this home.
Original Mortgage
$200,000
Interest Rate
8.14%
Mortgage Type
New Conventional
Create a Home Valuation Report for This Property
The Home Valuation Report is an in-depth analysis detailing your home's value as well as a comparison with similar homes in the area
Home Values in the Area
Average Home Value in this Area
Purchase History
| Date | Buyer | Sale Price | Title Company |
|---|---|---|---|
| Rairdan Brian D | -- | None Available | |
| Rairdan Brian D | $282,000 | North American Title Agency | |
| Corbin Carol G | $245,000 | North American Title Agency | |
| Kane William James | $237,000 | Transnation Title Ins Co |
Source: Public Records
Mortgage History
| Date | Status | Borrower | Loan Amount |
|---|---|---|---|
| Closed | Rairdan Brian D | $105,000 | |
| Previous Owner | Kane William James | $200,000 |
Source: Public Records
Tax History Compared to Growth
Tax History
| Year | Tax Paid | Tax Assessment Tax Assessment Total Assessment is a certain percentage of the fair market value that is determined by local assessors to be the total taxable value of land and additions on the property. | Land | Improvement |
|---|---|---|---|---|
| 2025 | $3,619 | $42,387 | -- | -- |
| 2024 | $3,531 | $40,369 | -- | -- |
| 2023 | $3,531 | $58,070 | $11,610 | $46,460 |
| 2022 | $3,489 | $45,150 | $9,030 | $36,120 |
| 2021 | $3,519 | $40,300 | $8,060 | $32,240 |
| 2020 | $3,399 | $37,880 | $7,570 | $30,310 |
| 2019 | $3,414 | $36,660 | $7,330 | $29,330 |
| 2018 | $3,290 | $34,460 | $6,890 | $27,570 |
| 2017 | $3,142 | $33,600 | $6,720 | $26,880 |
| 2016 | $3,092 | $32,330 | $6,460 | $25,870 |
| 2015 | $2,869 | $31,770 | $6,350 | $25,420 |
Source: Public Records
Map
Nearby Homes
- 5720 E Marilyn Rd
- 5910 E Hillery Dr Unit 21
- 14627 N 55th Place
- 5920 E Gelding Dr
- 14248 N 56th Place
- 5811 E Crocus Dr
- 14208 N 57th Place
- 6054 E Nisbet Rd
- 5532 E Crocus Dr
- 5704 E Estrid Ave
- 5411 E Acoma Dr
- 5819 E Redfield Rd
- 5834 E Friess Dr
- 6049 E Crocus Dr
- 15020 N 54th Place
- 6017 E Beck Ln
- 6157 E Janice Way
- 5439 E Piping Rock Rd
- 15034 N 54th St
- 6155 E Karen Dr
- 5726 E Claire Dr
- 5737 E Marilyn Rd
- 5731 E Marilyn Rd
- 14633 N 58th St
- 14639 N 58th St
- 5725 E Marilyn Rd
- 14627 N 58th St
- 14801 N 58th St
- 5725 E Claire Dr
- 5719 E Marilyn Rd
- 14807 N 58th St
- 14621 N 58th St
- 5714 E Claire Dr
- 5738 E Marilyn Rd
- 5719 E Claire Dr
- 5732 E Marilyn Rd
- 5726 E Everett Dr
- 5726 E Marilyn Rd
- 14813 N 58th St
- 5713 E Marilyn Rd