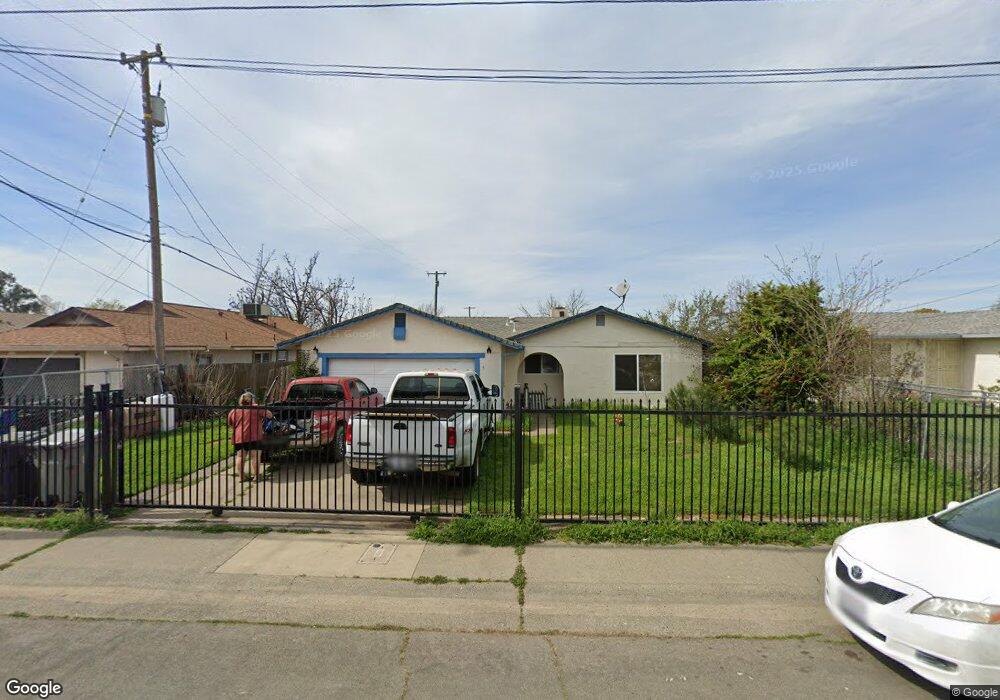
5732 Wilkinson St Sacramento, CA 95824
Avondale NeighborhoodEstimated Value: $323,000 - $512,000
3
Beds
2
Baths
1,372
Sq Ft
$305/Sq Ft
Est. Value
About This Home
This home is located at 5732 Wilkinson St, Sacramento, CA 95824 and is currently estimated at $418,400, approximately $304 per square foot. 5732 Wilkinson St is a home located in Sacramento County with nearby schools including Earl Warren Elementary School, Will C. Wood Middle School, and Hiram W. Johnson High School.
Ownership History
Date
Name
Owned For
Owner Type
Purchase Details
Closed on
Nov 23, 2009
Sold by
Borlovan Samuel S and Borlovan Dorel
Bought by
Borlovan Dorel
Current Estimated Value
Purchase Details
Closed on
Aug 16, 2002
Sold by
Borlovan Samuel S
Bought by
Borlovan Samuel S and Borlovan Dorel
Home Financials for this Owner
Home Financials are based on the most recent Mortgage that was taken out on this home.
Original Mortgage
$91,000
Interest Rate
6.52%
Purchase Details
Closed on
Mar 18, 1998
Sold by
Pak No C & Chong Yo
Bought by
Borlovan Samuel S and Borlovan Dorel
Home Financials for this Owner
Home Financials are based on the most recent Mortgage that was taken out on this home.
Original Mortgage
$89,612
Interest Rate
7.11%
Mortgage Type
FHA
Create a Home Valuation Report for This Property
The Home Valuation Report is an in-depth analysis detailing your home's value as well as a comparison with similar homes in the area
Home Values in the Area
Average Home Value in this Area
Purchase History
| Date | Buyer | Sale Price | Title Company |
|---|---|---|---|
| Borlovan Dorel | -- | None Available | |
| Borlovan Samuel S | -- | Alliance Title Company | |
| Borlovan Samuel S | -- | Alliance Title Company | |
| Borlovan Samuel S | $100,000 | Fidelity National Title Co |
Source: Public Records
Mortgage History
| Date | Status | Borrower | Loan Amount |
|---|---|---|---|
| Closed | Borlovan Samuel S | $91,000 | |
| Previous Owner | Borlovan Samuel S | $89,612 |
Source: Public Records
Tax History Compared to Growth
Tax History
| Year | Tax Paid | Tax Assessment Tax Assessment Total Assessment is a certain percentage of the fair market value that is determined by local assessors to be the total taxable value of land and additions on the property. | Land | Improvement |
|---|---|---|---|---|
| 2025 | $1,753 | $141,974 | $45,171 | $96,803 |
| 2024 | $1,753 | $139,191 | $44,286 | $94,905 |
| 2023 | $1,711 | $136,463 | $43,418 | $93,045 |
| 2022 | $2,585 | $133,788 | $42,567 | $91,221 |
| 2021 | $1,602 | $131,166 | $41,733 | $89,433 |
| 2020 | $3,656 | $129,822 | $41,306 | $88,516 |
| 2019 | $1,576 | $127,278 | $40,497 | $86,781 |
| 2018 | $1,534 | $124,783 | $39,703 | $85,080 |
| 2017 | $1,511 | $122,337 | $38,925 | $83,412 |
| 2016 | $1,477 | $119,939 | $38,162 | $81,777 |
| 2015 | $1,453 | $118,138 | $37,589 | $80,549 |
| 2014 | $1,416 | $115,825 | $36,853 | $78,972 |
Source: Public Records
Map
Nearby Homes
- 5618 Wilkinson St
- 7909 35th Ave
- 7922 35th Ave
- 7440 38th Ave
- 5690 Power Inn Rd
- 7021 Fruitridge Rd
- 7441 Peacock Way
- 7330 Peacock Way
- 5351 Whittier Dr
- 5411 70th St
- 5240 Emerson Rd
- 6801 38th Ave
- 5 Enniskillen Ct
- 5210 71st St
- 5211 Whittier Dr
- 5111 71st St
- 4950 76th St
- 5020 Emerson Rd
- 6152 Lemon Bell Way
- 4921 Concord Rd
- 5740 Wilkinson St
- 5738 Wilkinson St
- 5724 Wilkinson St
- 5708 Wilkinson St
- 5716 Wilkinson St
- 5733 Wallace Ave
- 5733 Wallace Ave
- 5756 Wilkinson St
- 5700 Wilkinson St
- 5725 Wilkinson St
- 5721 Wilkinson St
- 7704 33rd Ave
- 5735 Wilkinson St
- 7700 33rd Ave
- 5745 Wilkinson St
- 5707 Wilkinson St
- 7701 34th Ave
- 5690 Wilkinson St
- 5772 Wilkinson St
- 5772 Wilkison St